Dashboards
A dashboard is a page you build yourself to watch your fleet. Each dashboard is made of one or more named tabs, and each tab holds the widgets you arrange on it.
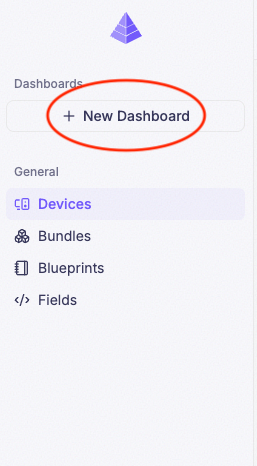
Dashboards live in the left sidebar. Until you create your first one the sidebar shows a single New Dashboard button; after that it lists your pinned dashboards, with Manage Dashboards underneath for everything else.
What a widget can show you
A widget queries data that has already been recorded. It never asks a device for anything. Building a widget does not cause a device to start sending — if the value never arrived, the widget is blank and nothing about the widget, the device, or the app looks wrong.
Everything else about widgets follows from this:
- A widget can only show values that are still inside your data retention window. Setting a Time Range longer than retention shows a shorter window, not more data.
- A widget reads device fields. If the field was never defined, the value was dropped on arrival and there is nothing to read.
- Retain exists because of this rule — it holds the last known value for up to 30 days, for sensors that only report occasionally.
The one exception is the Trigger widget, which sends commands the other direction. See Triggers send commands back.
Create a dashboard
Click New Dashboard in the sidebar
Before you have created anything, this button is all the sidebar shows. Once you have dashboards, the same button moves inside Manage Dashboards — see Pin a dashboard.
Enter a name and click Save
A dashboard takes a name and nothing else. Name it after what you are watching — cold-storage,
line-2-output — because this is the name you will pick from when you pin it.
A new dashboard arrives with one tab already in it, so you can add a widget straight away.
Add a widget
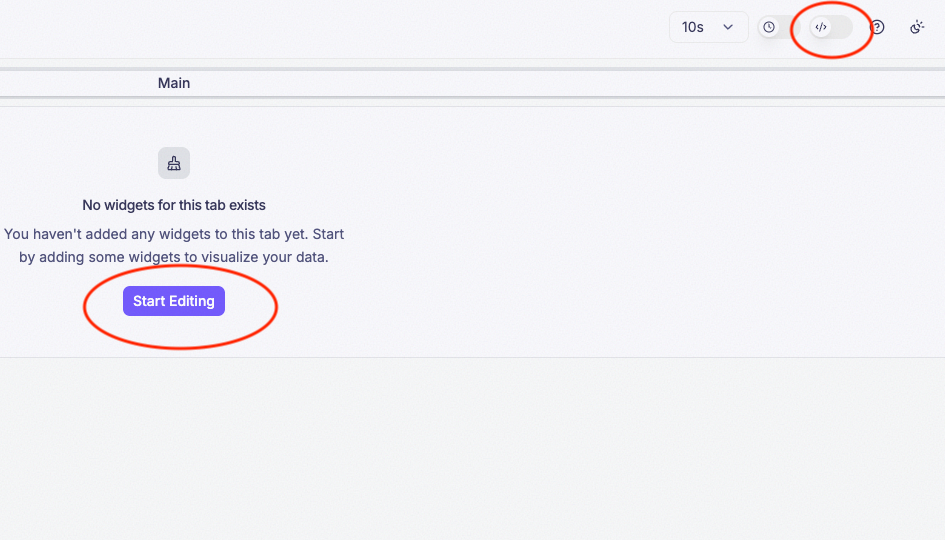
Open the dashboard and click Start Editing
There’s also a switch for editing the dashboard on the top navbar.
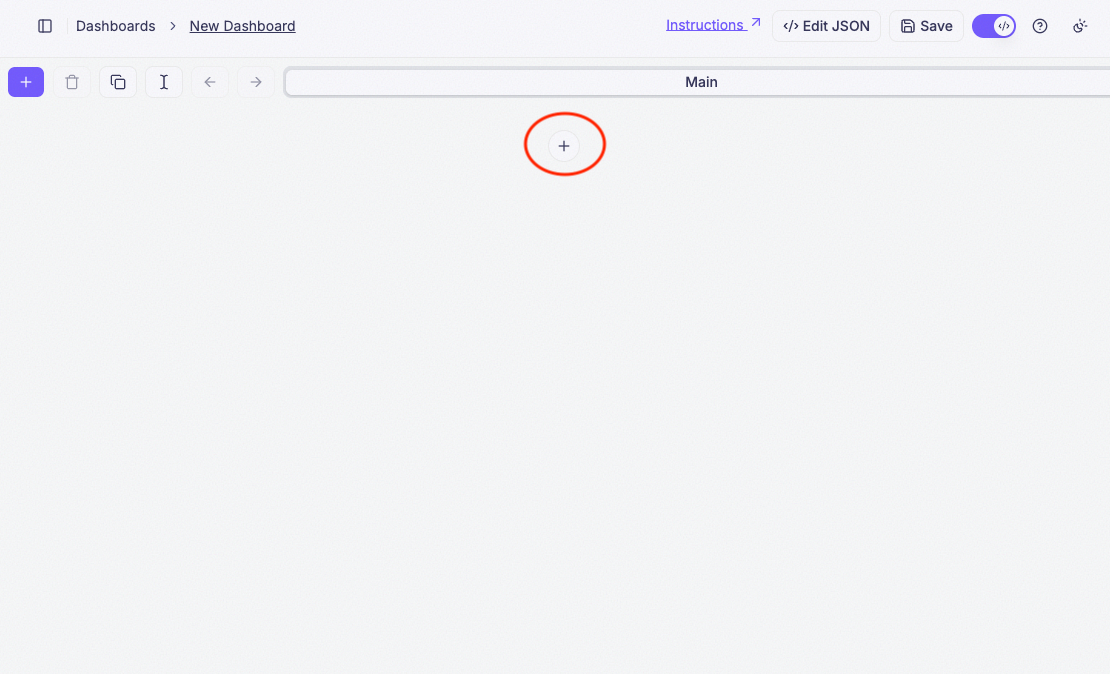
You need to be in desktop mode ent Edit mode
Click on the plus button to add a widget
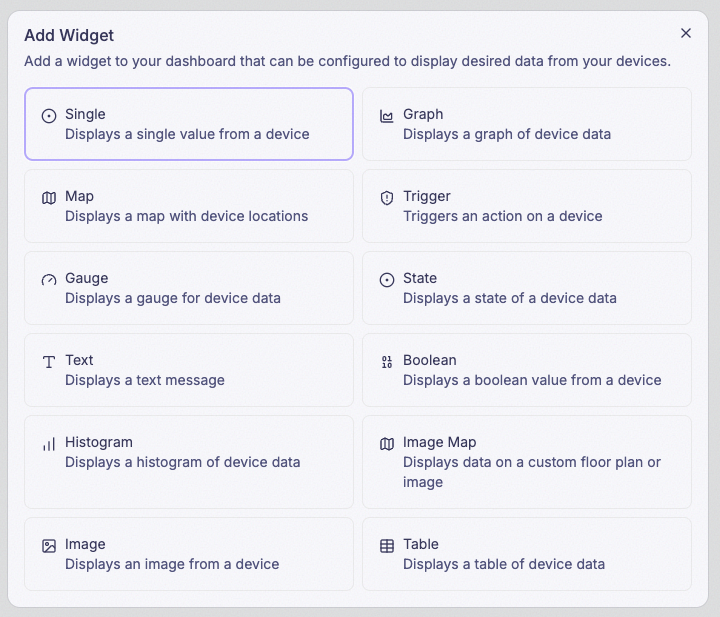
Choose a widget type
Pick the type that matches what you are showing — a single reading, a chart over time, a gauge, a map, a button. The Widget reference describes all twelve.
Set different settings
Nearly every widget takes the same four settings, whatever its type:
- Data Source — a single device, or a whole bundle. The grouping you deploy with is the grouping you monitor with, so one widget can cover the fleet.
- Field — which device field to read.
- Aggregate — how to summarise the readings. Anything other than Latest also needs a Time Range.
- Time Range — how far back to look, bounded by your retention window.
Each widget type adds its own settings on top of these. See the Widget reference for what each one needs.
Tabs
A dashboard is split into tabs, and each tab holds its own set of widgets. The name you give a tab is what appears on its label.
A new dashboard already has one tab, so you can ignore them entirely until a dashboard outgrows a
single screen. When it does, add a tab per view — overview, power, diagnostics — rather than
building a second dashboard.

Pin a dashboard
Pinning puts a dashboard in the left sidebar as a shortcut, and the most recently pinned dashboard is the one shown first. A company can have up to five pinned at a time.
Only pinned dashboards appear in the sidebar. Every other dashboard is reached through Manage Dashboard, the button underneath the pinned list. That is also where you pin and unpin, and where New Dashboard lives once you have created your first one.
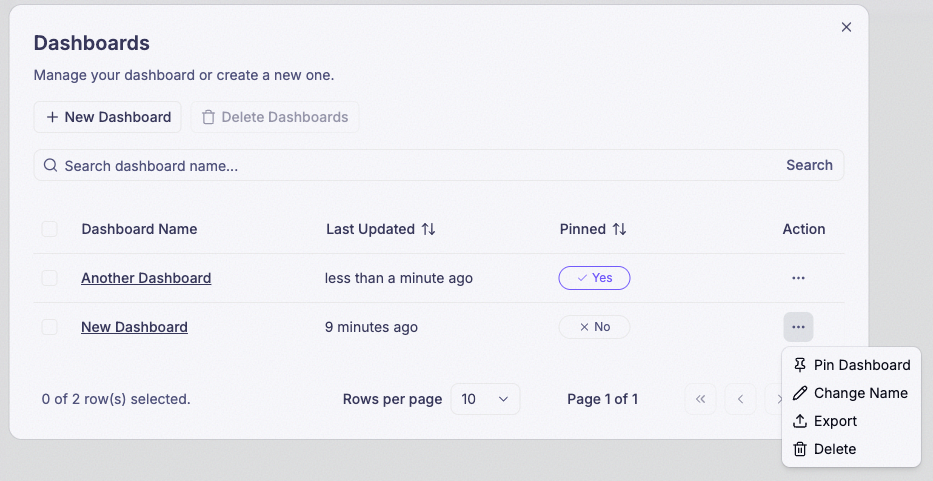
Pinning is company-wide, not personal. A dashboard you pin appears in the sidebar for every employee in the company, and unpinning removes it for everyone.
Share a dashboard with a public URL
Click a dashboard’s title in the top navbar to see its Public URL. Opening that link shows the dashboard to anyone who has it — no PRIZM account, no login, and no membership in your company required.

A public URL is not a read-only view. Anyone who opens it sees the dashboard exactly as a logged-in employee would, and can operate anything on it the same way — including pressing a Trigger widget.
Triggers send commands back
A Trigger widget is a button that sends a command to a device — a shutdown signal, a reboot, a relay toggle. It is the only widget that writes rather than reads.
An employee with the User role can press a Trigger.
Read-only governs whether someone can edit a dashboard, not whether they
can act through one. A dashboard carrying a SHUTDOWN button gives that
button to everyone who can see the dashboard — and pinning shows it to the
whole company.
Turn on Require Confirmation when configuring a Trigger to put a confirmation prompt in front of the command.
Why a widget shows no data
A widget that is configured correctly and still shows nothing is the most common dashboard problem, and it follows directly from the rule at the top of this page. Check these in order:
- The field has never received a value. Look at Device Events for the device. If nothing arrives there either, the app may be emitting an identifier with no matching field — in which case the value is dropped on arrival.
- The device is Offline, or every device in the bundle is. Work through Troubleshooting.
- The Time Range reaches past your retention window. Nothing older than retention exists to show.
- The sensor reports rarely and Retain is off. Turn Retain on to hold the last known value.
- The Data Source does not report that field. A device can be registered and healthy and still never send the field the widget is asking for.
Dashboards are safe to change
A dashboard is a view over data it does not own. Deleting a dashboard, deleting a tab, or removing a widget destroys no data — the recorded field values are untouched, and every other widget reading them keeps working.
Rearranging a dashboard is not a decision you need to be careful about. Deleting the field behind a widget is.
Dashboards do not notify you
A dashboard shows you what is happening while you are looking at it. To be told when something happens, use an alert — alerts are configured in the Blueprint Editor and can send a notification, an SMS, or an email.
Who can build dashboards
Creating, editing, and pinning dashboards requires the Owner or Admin role. Employees with the User role can view every dashboard and, as above, can still press a Trigger.
Widget reference
This guide covers what each widget adds on top of the settings many widgets share — Data Source,
Field, Aggregate, and Time Range —
introduced in Add a widget. Not every widget has all four: Boolean
and Image always use LATEST with no Time Range to set, Map has no Aggregate setting at all and
only shows a Time Range once Show History is turned on, Text has no data source at all, and
Trigger doesn’t read anything. Most widget editors split their settings across a couple of tabs —
typically General for Title and Description, Data for everything about the reading itself, and
sometimes more (Fields, States, Thresholds, Reference). Each widget’s own page walks through its tabs one
at a time, after you’ve picked its type from the widget picker.
Every widget reads data that has already arrived; if you haven’t seen that rule yet, read What a widget can show you first, since it explains why a correctly configured widget can still show nothing.
The twelve widgets
- Single Value — one number, aggregated one way, shown once.
- Graph — one or more fields plotted as lines, bars, or an area over time.
- State — a numeric value turned into a color and a word.
- Gauge — a value shown as a position on a dial.
- Trigger — a button that sends a command to a device.
- Histogram — how often a reading fell into each of several value ranges.
- Boolean — a true/false field shown as custom text.
- Text — static text; nothing here is read from a device.
- Image Map — live readings placed on a picture you supply.
- Image — the most recent image payload a device has sent.
- Table — several other widgets laid out in a grid.
- Map — a device’s reported GPS position plotted on a map.