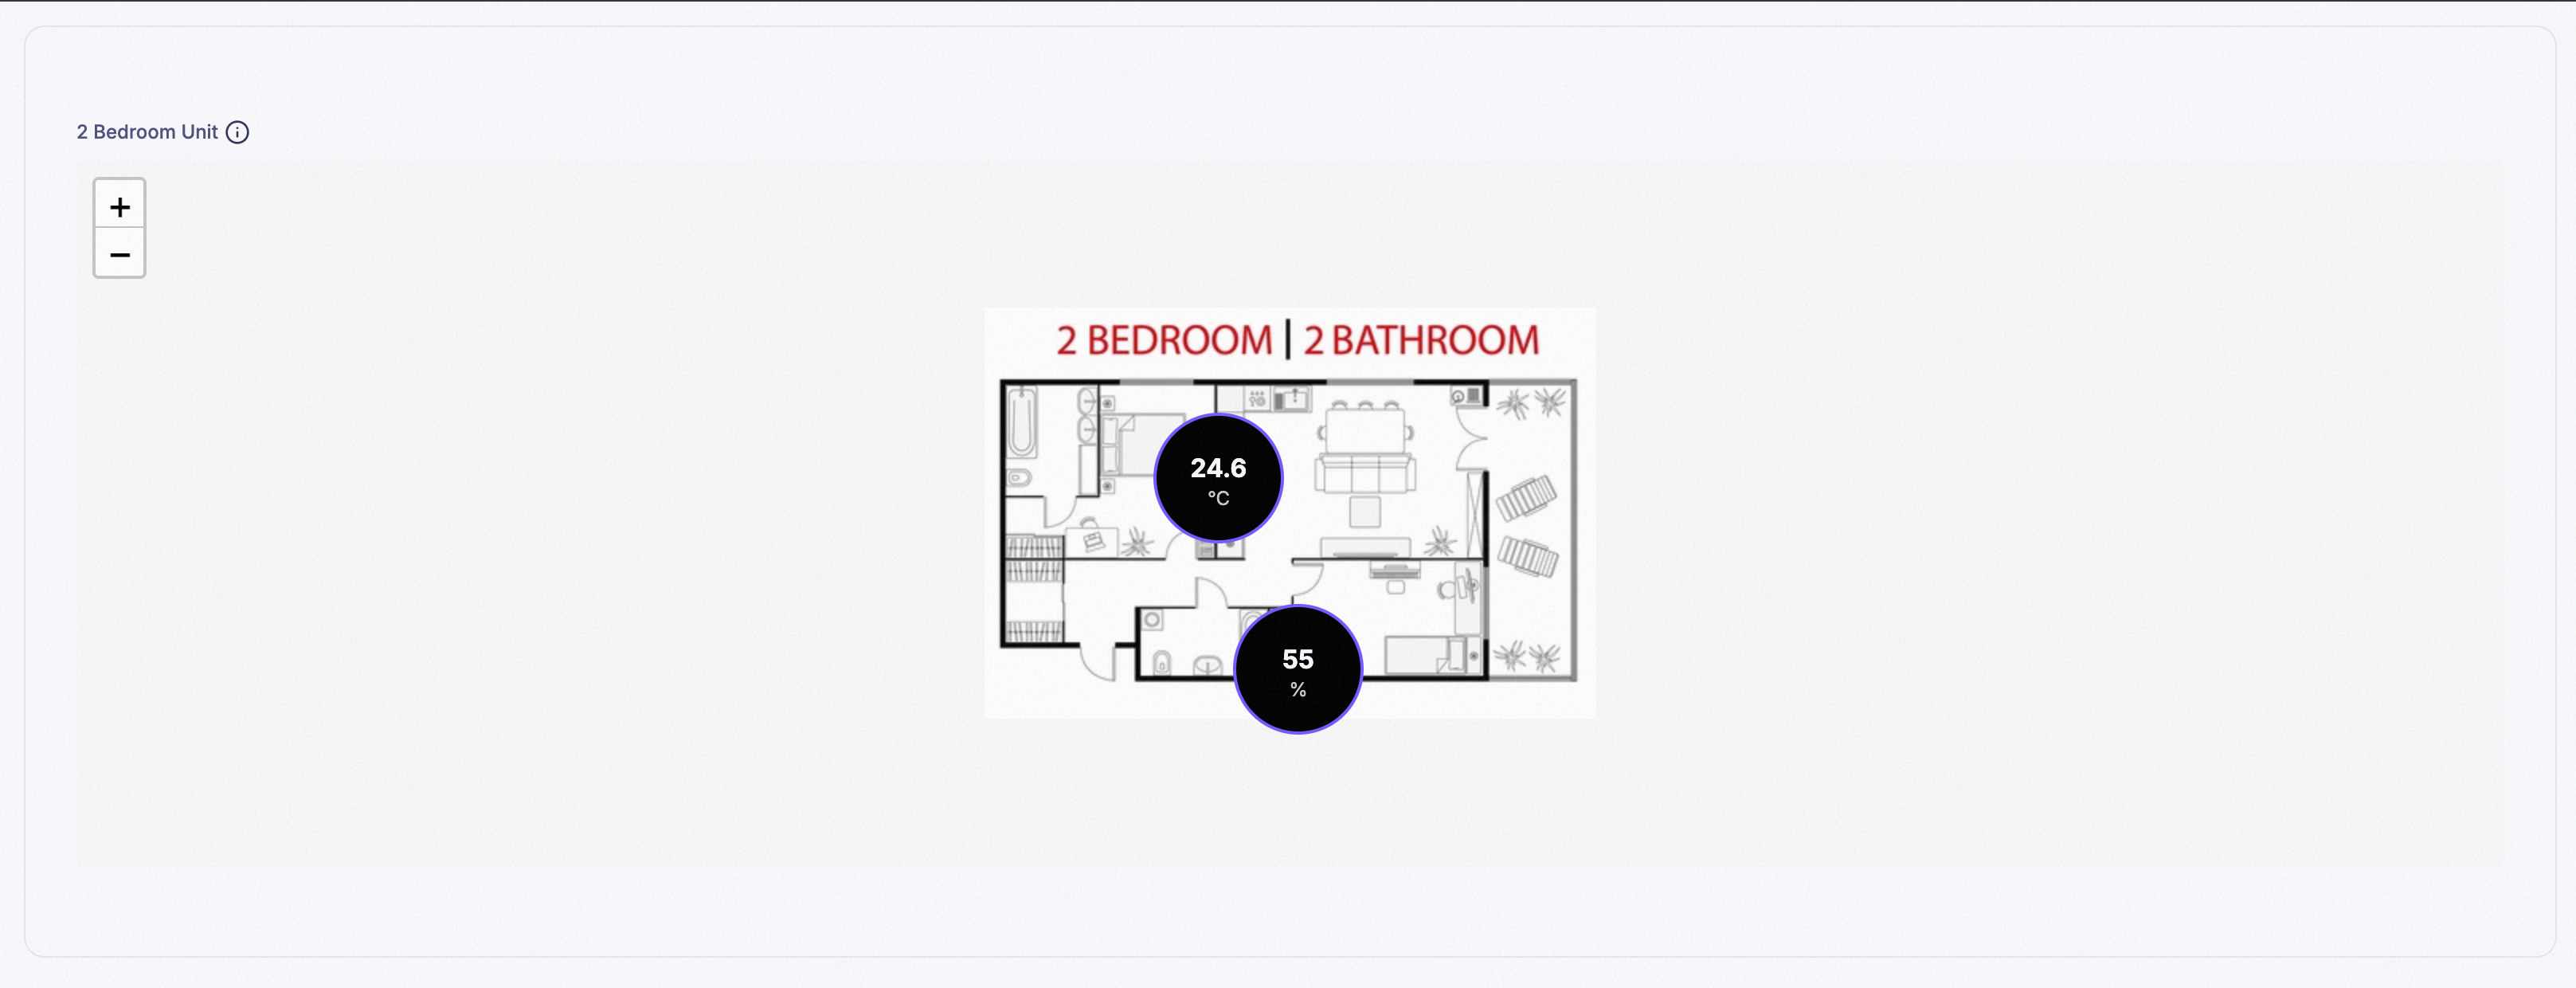
9. Image Map Widget
Places live readings directly on a picture you supply, so the layout of the data matches the layout of the thing it describes. A Table or a row of Single Value widgets shows the same numbers, but loses the spatial relationship between them — which room is next to which, which server sits above which. Image Map keeps that relationship by letting you place each reading exactly where it belongs on a floor plan, rack diagram, or schematic. You can’t add any data points until an image is uploaded.
- Examples:
- Overlaying temperature readings on specific rooms displayed over a building’s floor plan.
- Mapping the active status of servers over a schematic of a server rack.
Step 1: Set Title and Description
Title is what’s actually displayed as the widget’s heading. Description isn’t shown on the card at all — it only appears in a tooltip when someone hovers the info icon (ⓘ) next to the title.
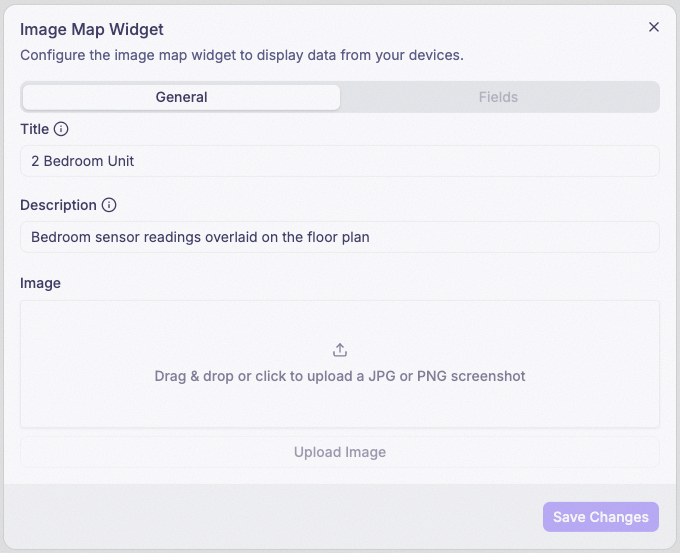
Step 2: Attach an image
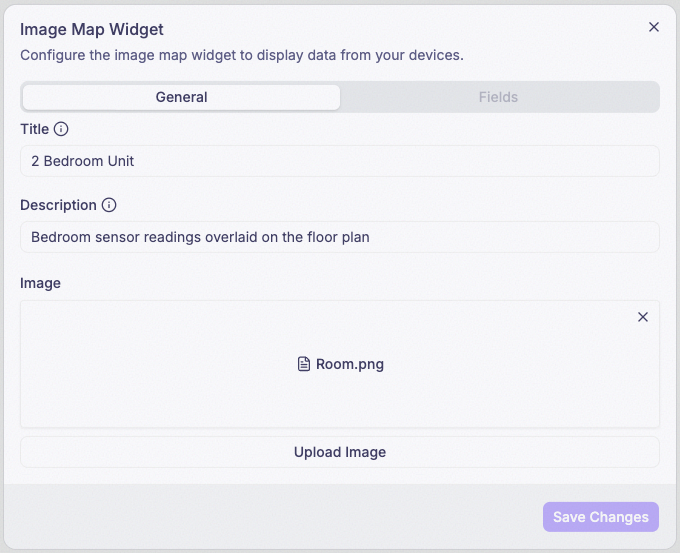
Step 3: Click Upload Image
This is what unlocks adding data points in the next steps.
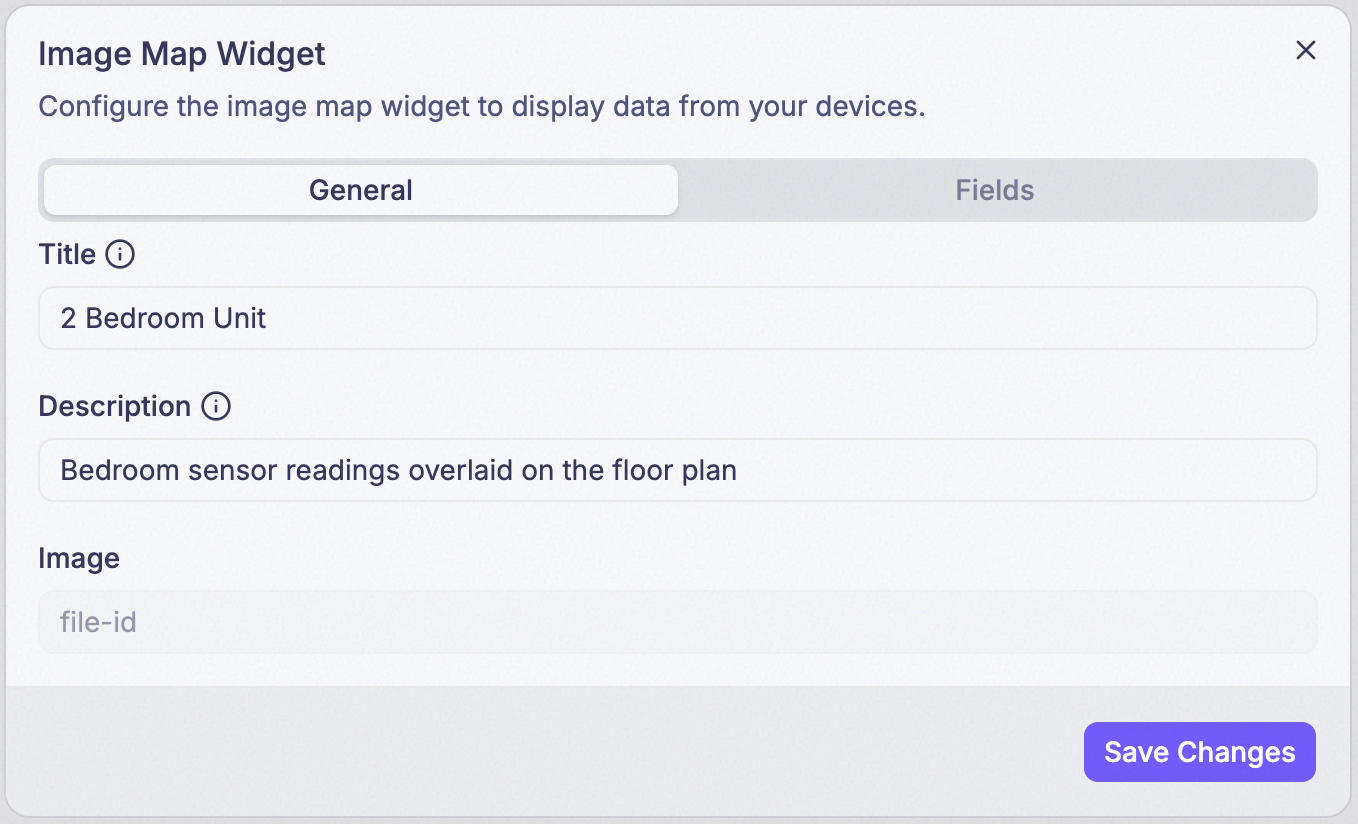
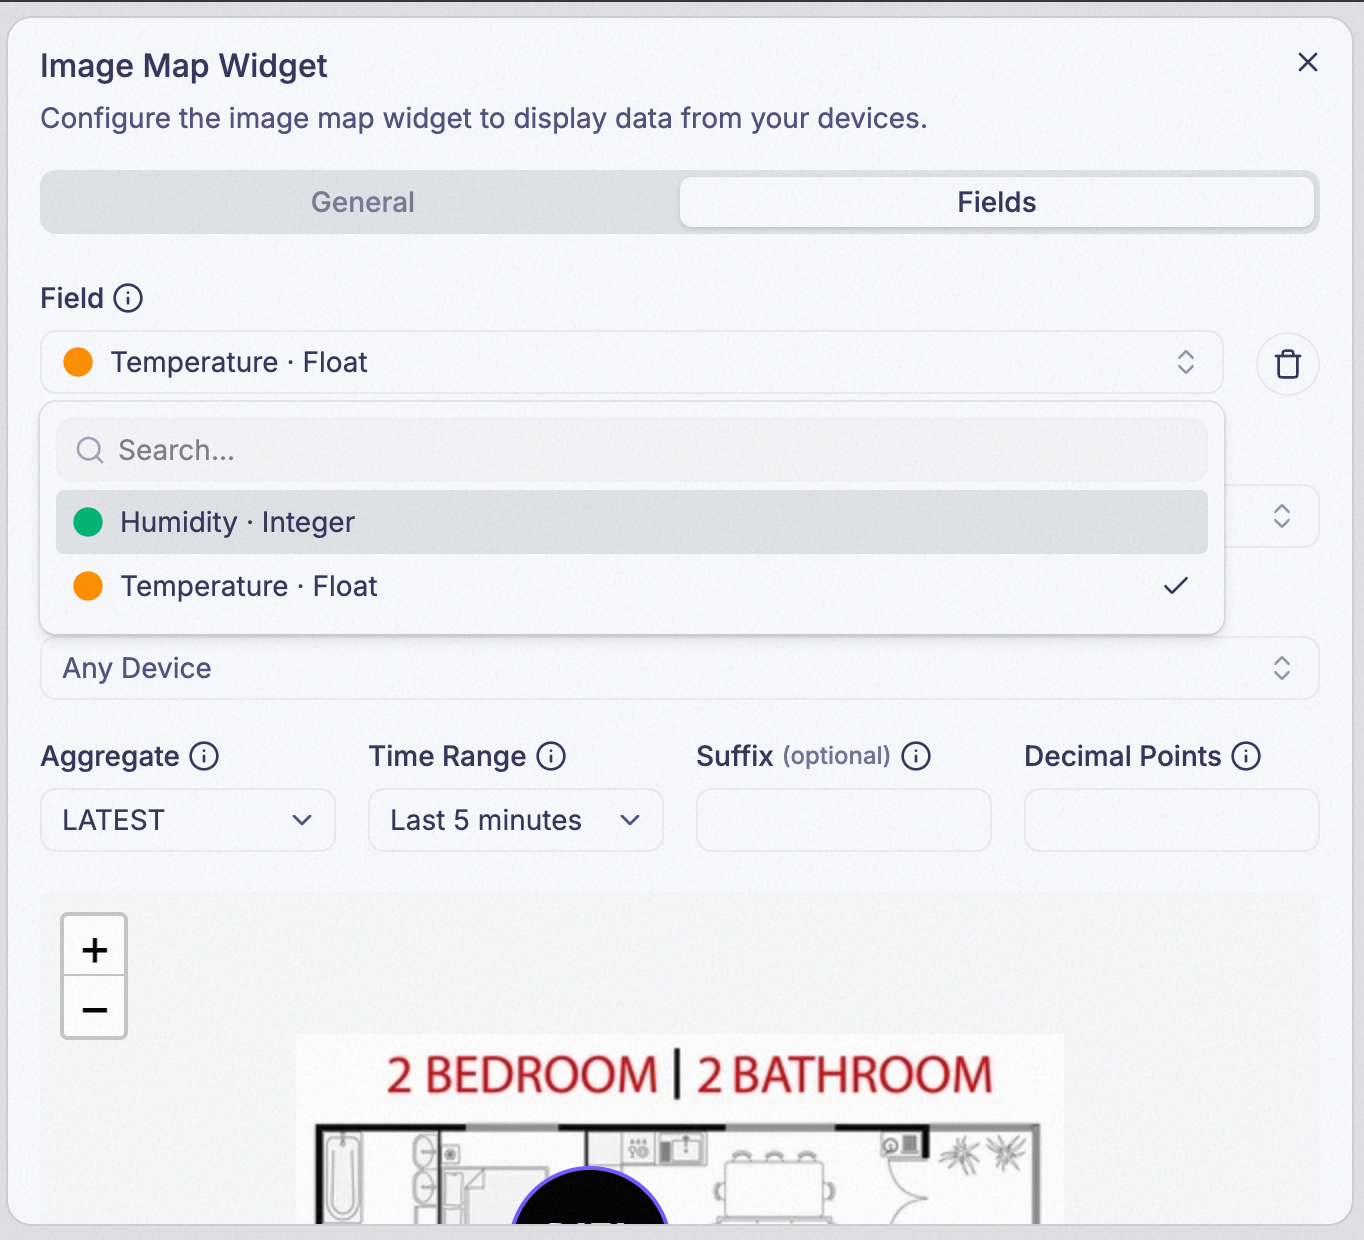
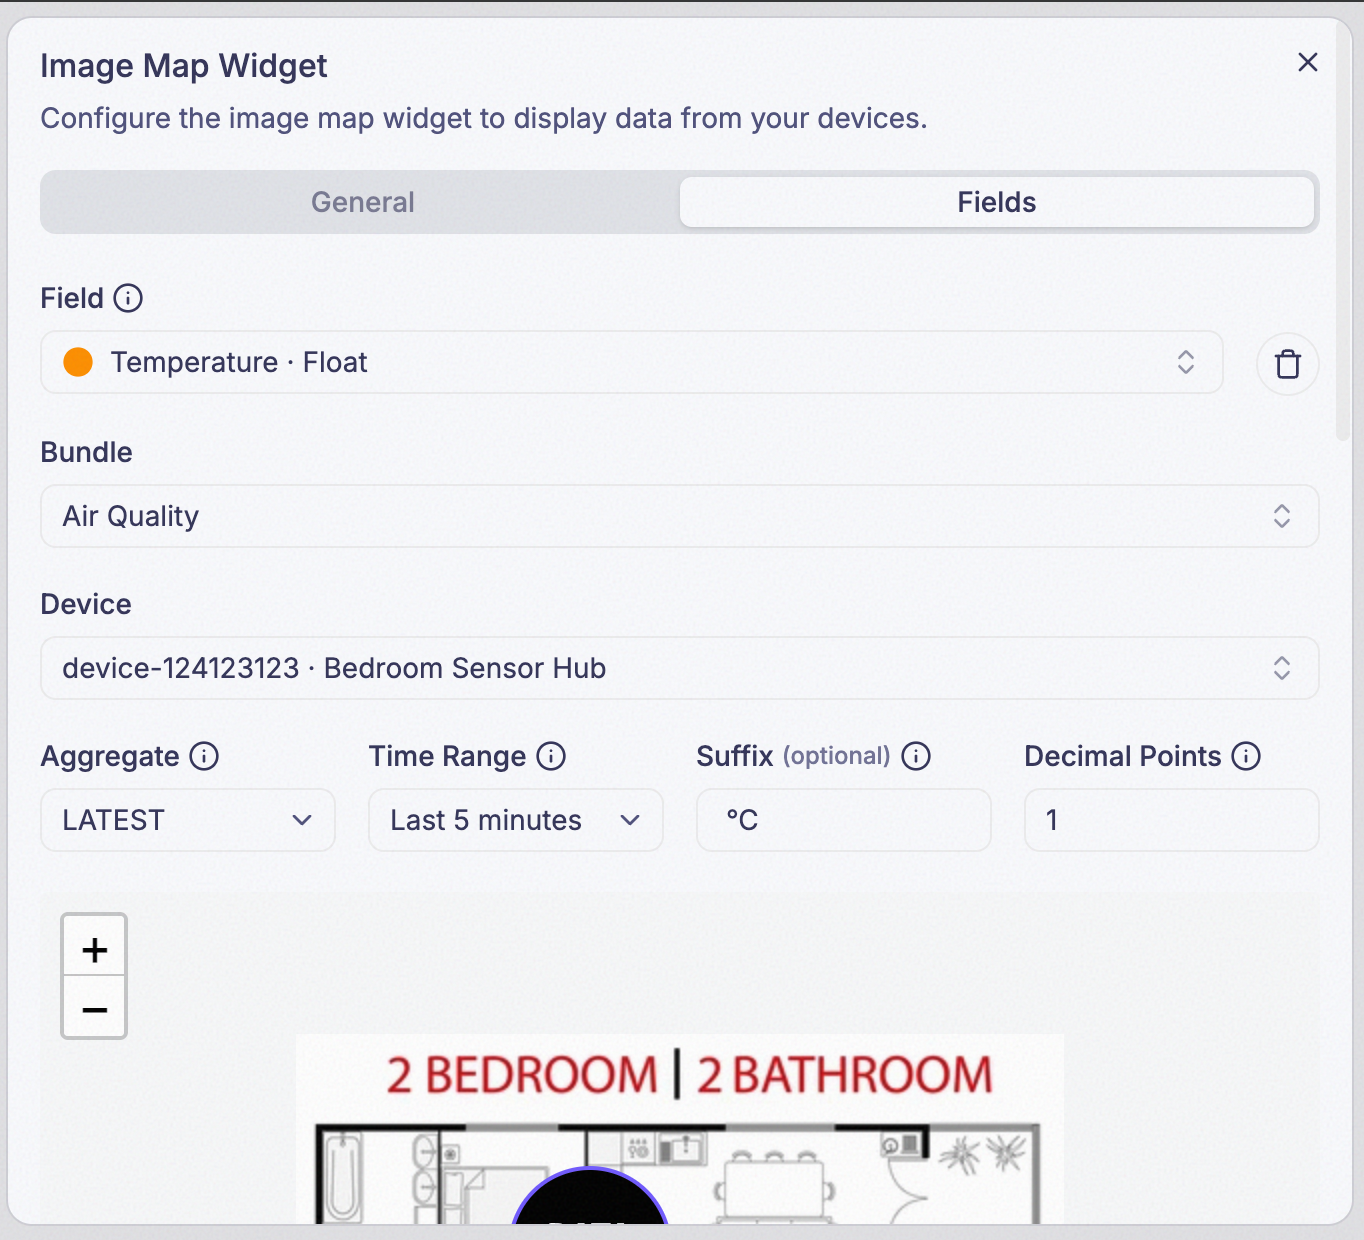
Step 4: Add the Field for a data point
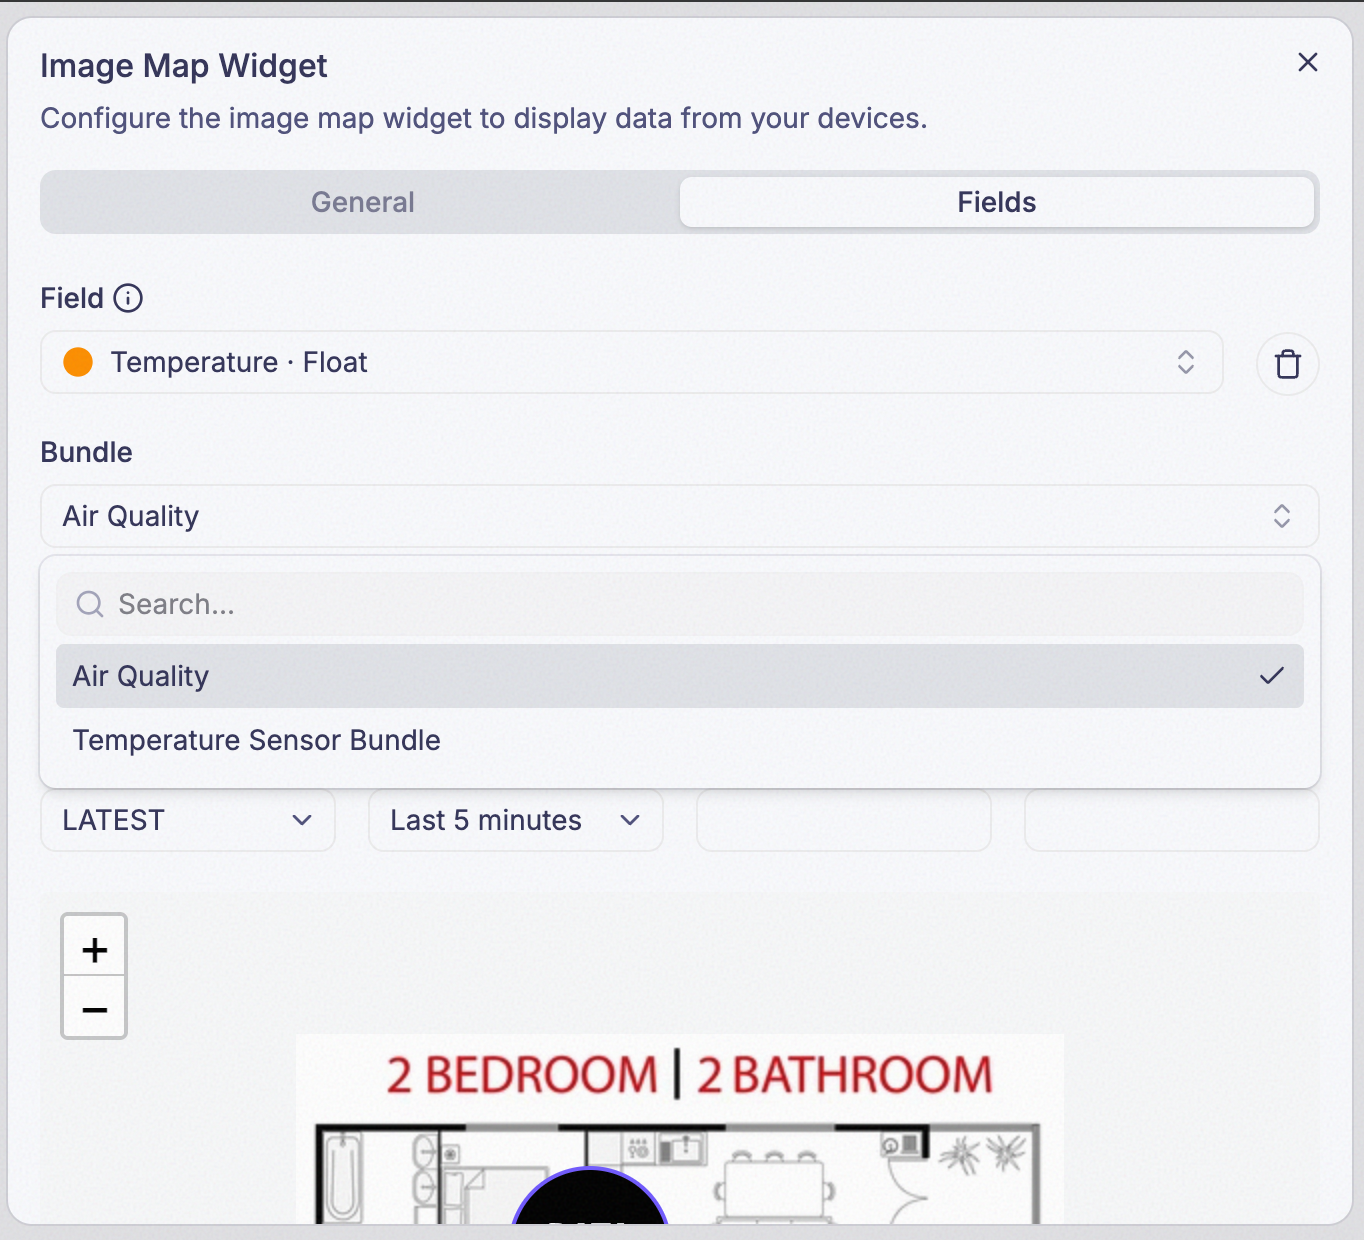
Step 5: Choose a Bundle (optional)
Points this data point at every device in a bundle instead of one device. Leave it blank to pick a single device instead, in the next step.
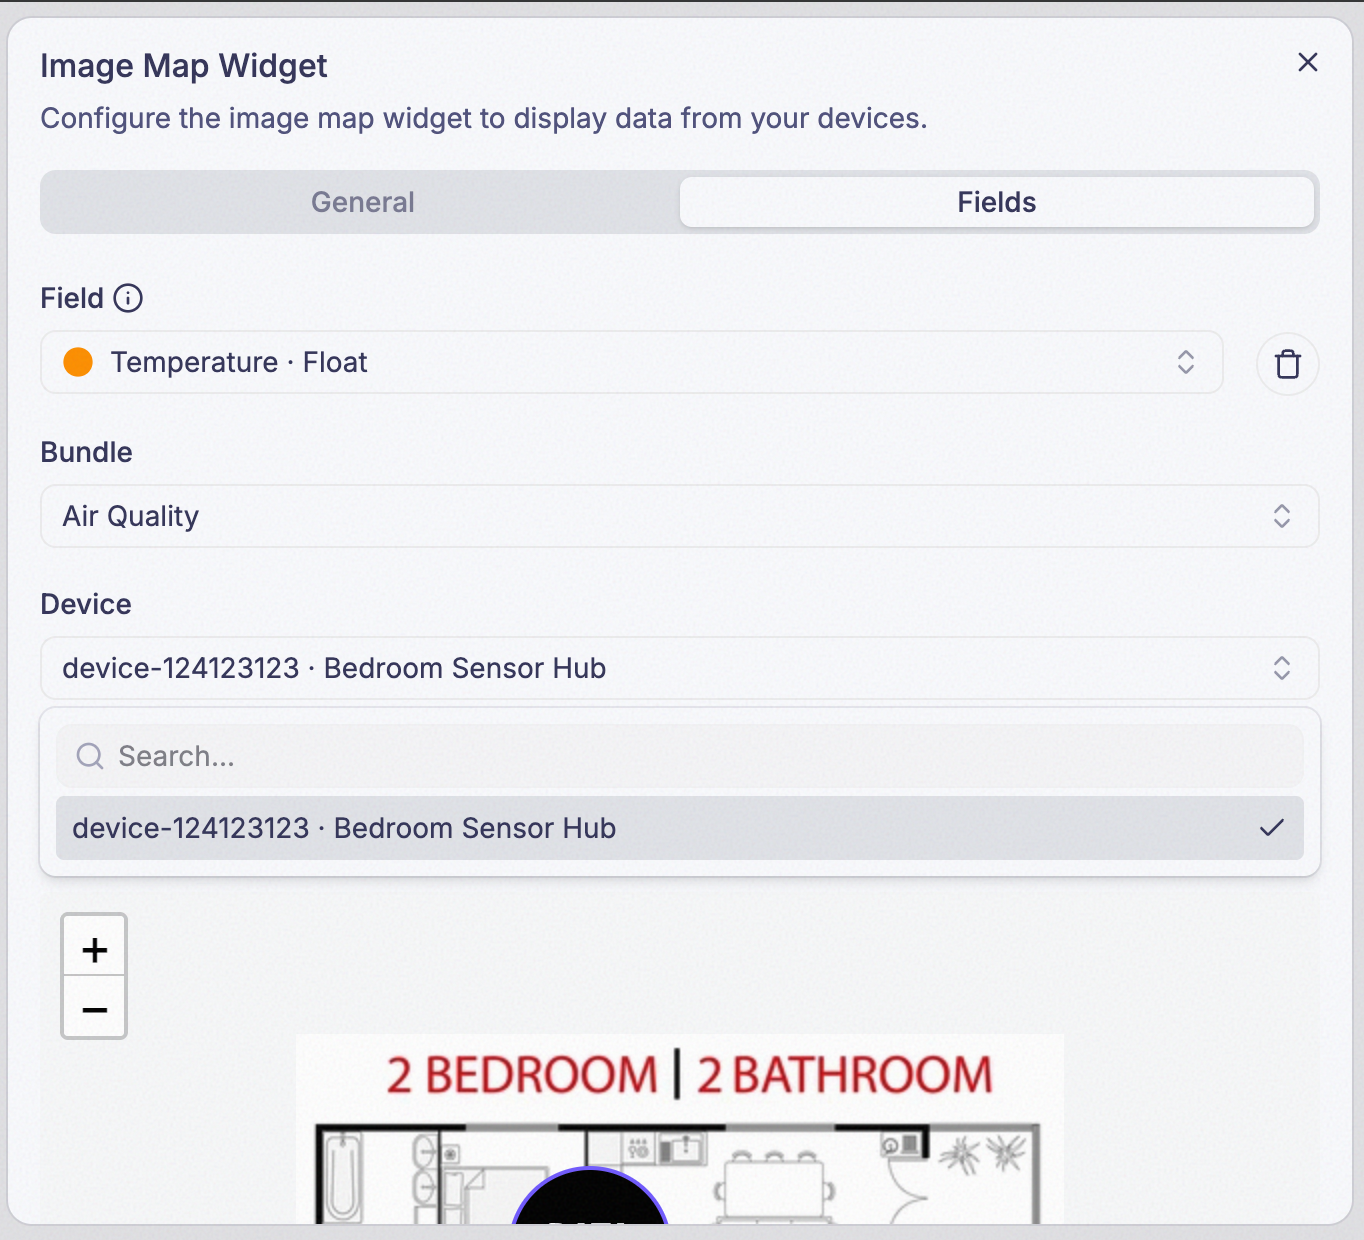
Step 6: Choose a Device (optional)
Points this data point at one specific device. Leave both Bundle and Device blank and it reads from any device that reports the field.
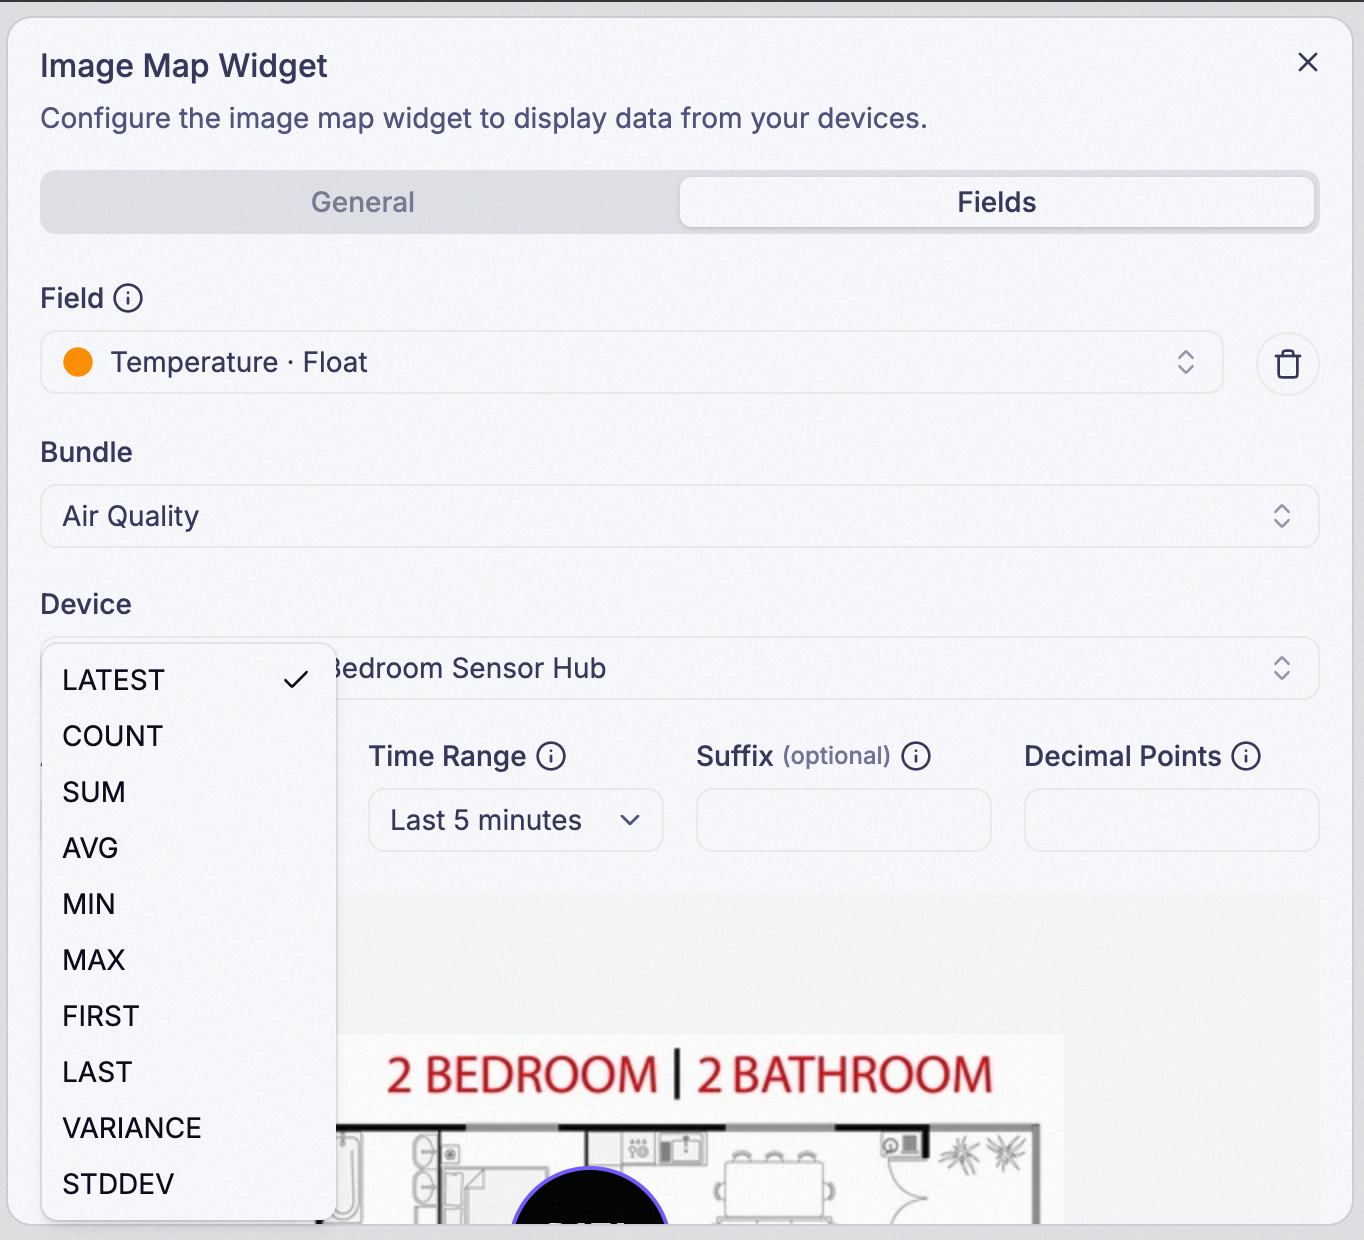
Step 7: Choose an Aggregate
Aggregate decides which single number the point shows — the same modes as the Single Value Widget:
| Mode | Shows |
|---|---|
LATEST | The most recent reading — ignores Time Range; see the callout below |
COUNT | How many readings arrived |
SUM | All readings added together |
AVG | The average of all readings |
MIN | The lowest reading |
MAX | The highest reading |
FIRST | The earliest reading inside the Time Range |
LAST | The most recent reading inside the Time Range |
VARIANCE | Statistical variance of the readings |
STDDEV | Standard deviation of the readings |
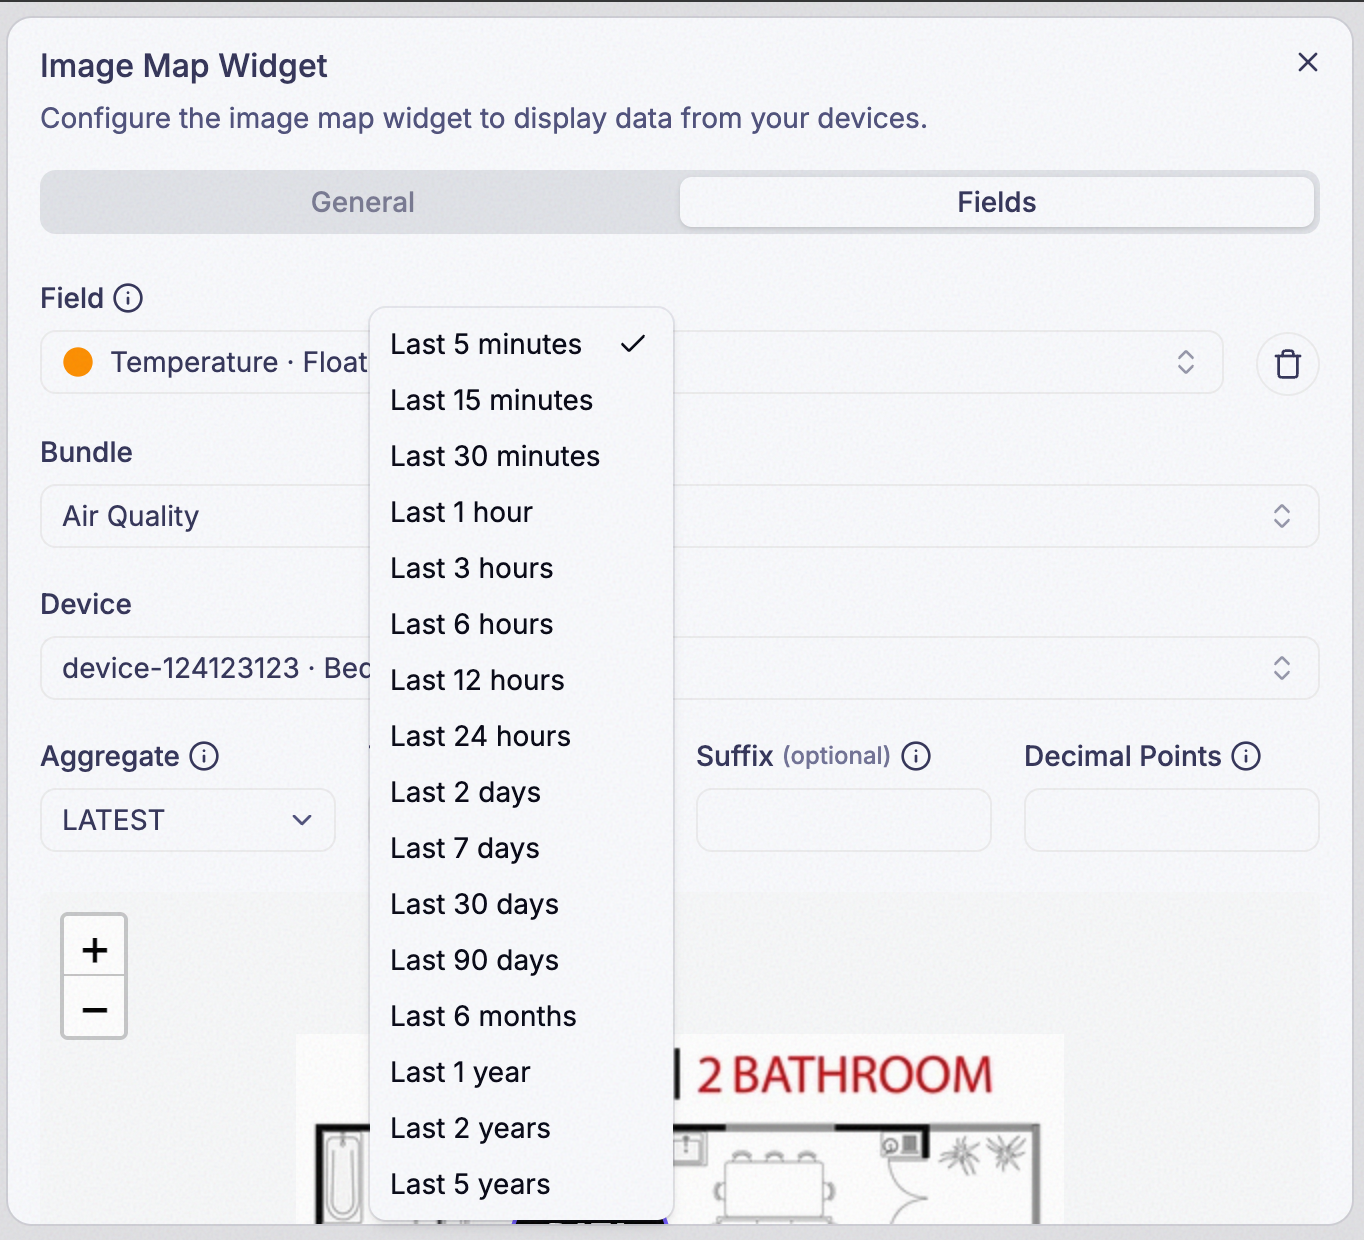
Step 8: Set Time Range
Unlike the Single Value Widget, this field stays visible even when Aggregate is LATEST — it isn’t
hidden here, though LATEST still ignores it (see the callout below).
Step 9: Set Suffix and Decimal Points
Both optional, and both only change how the point’s number is displayed.
Step 10: Drag the point into position
Once configured, drag the data point to wherever it belongs on the image. It stays fixed there — the point itself doesn’t move on its own, only the number it displays updates.
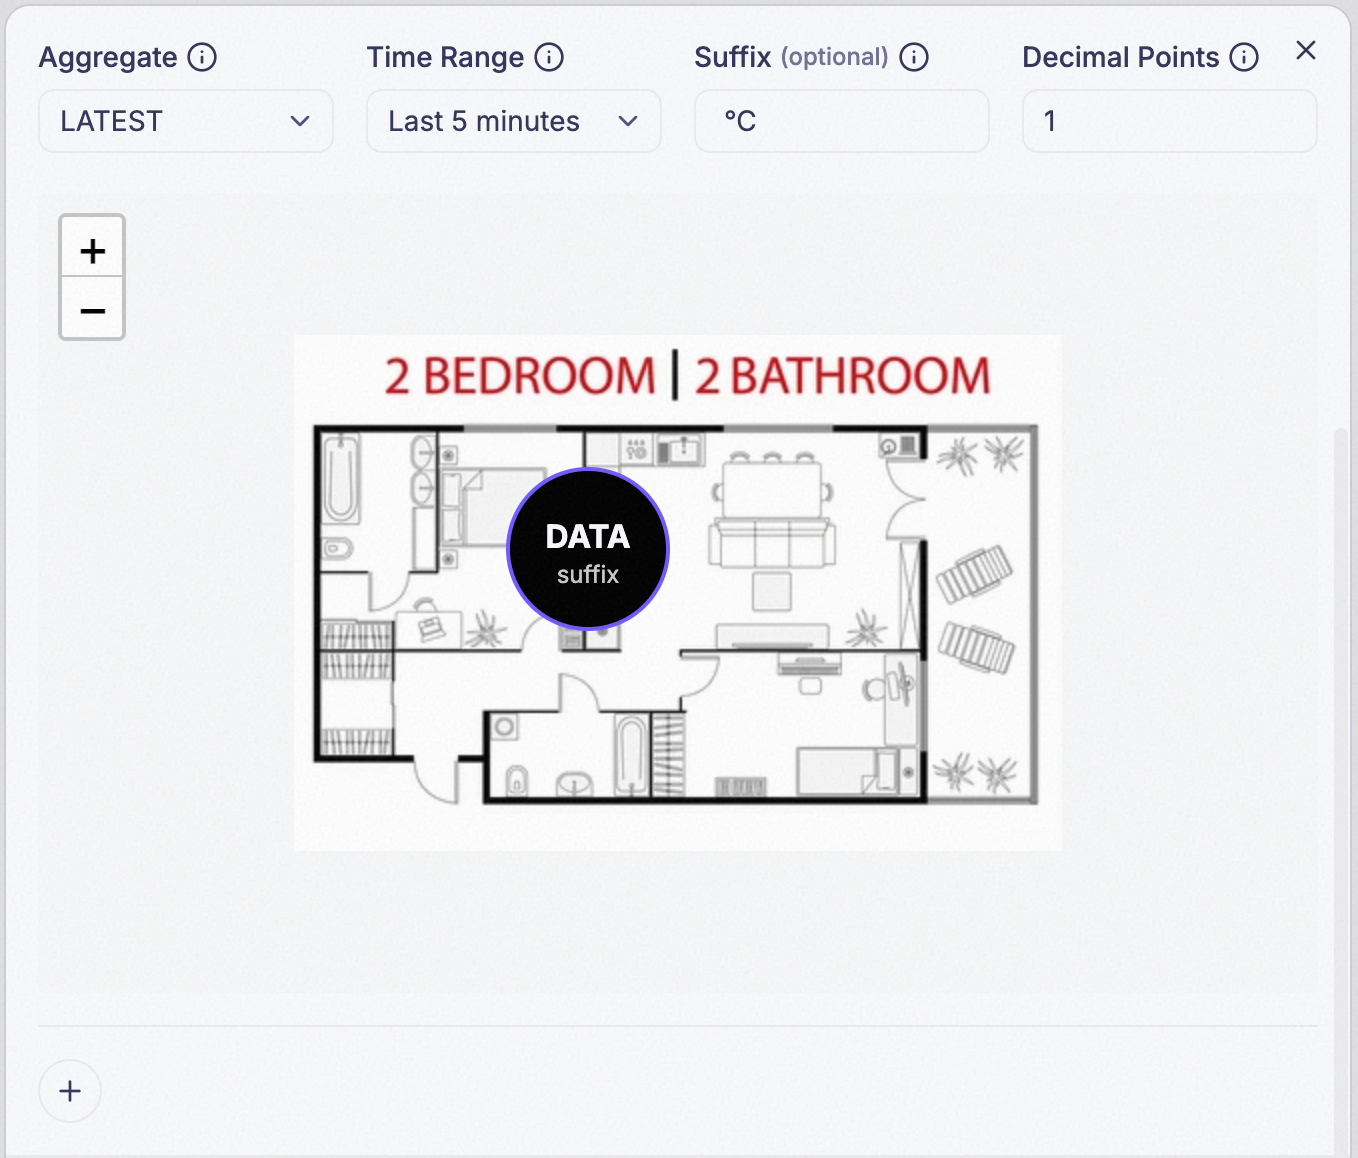
Each point behaves like a miniature Single Value widget, so it can go blank for the same reasons a standalone one would — see Why a widget shows no data. A blank point doesn’t mean the other points on the same map are wrong.
LATEST and LAST sound like the same thing and aren’t. LAST respects
whatever Time Range you set; LATEST ignores Time Range entirely and
looks back 15 minutes on its own. Unlike the Single Value Widget, a
data point here has no Retain setting to extend that window — see the
full explanation on the Single Value
Widget page.
Example