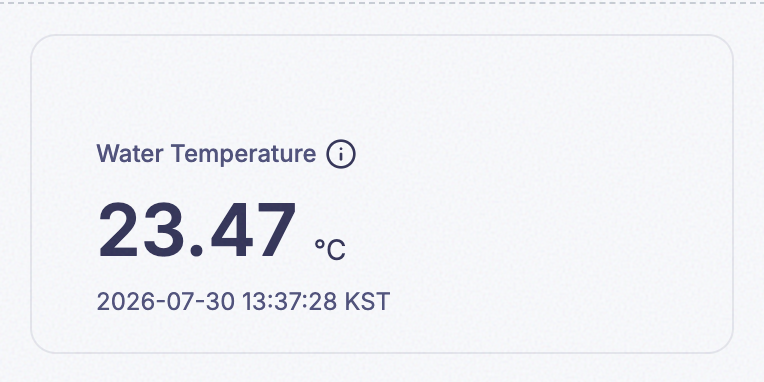
1. Single Value Widget
The simplest widget: one number, aggregated one way, shown once. Reach for it whenever the question is “what is this reading right now” or “what did this add up to.” It’s also the most common widget on most dashboards, because it’s the fastest way to answer a single question without any chart to read — and it’s the widget several others are built on top of: a Table Data Cell and an Image Map data point are both, under the hood, a Single Value reading with its Title and Description stripped out.
- Examples:
- Current temperature in a room.
- Total items produced by a machine today.
- The minimum battery level recorded for a device in the last 24 hours.
Step 1: Set Title and Description
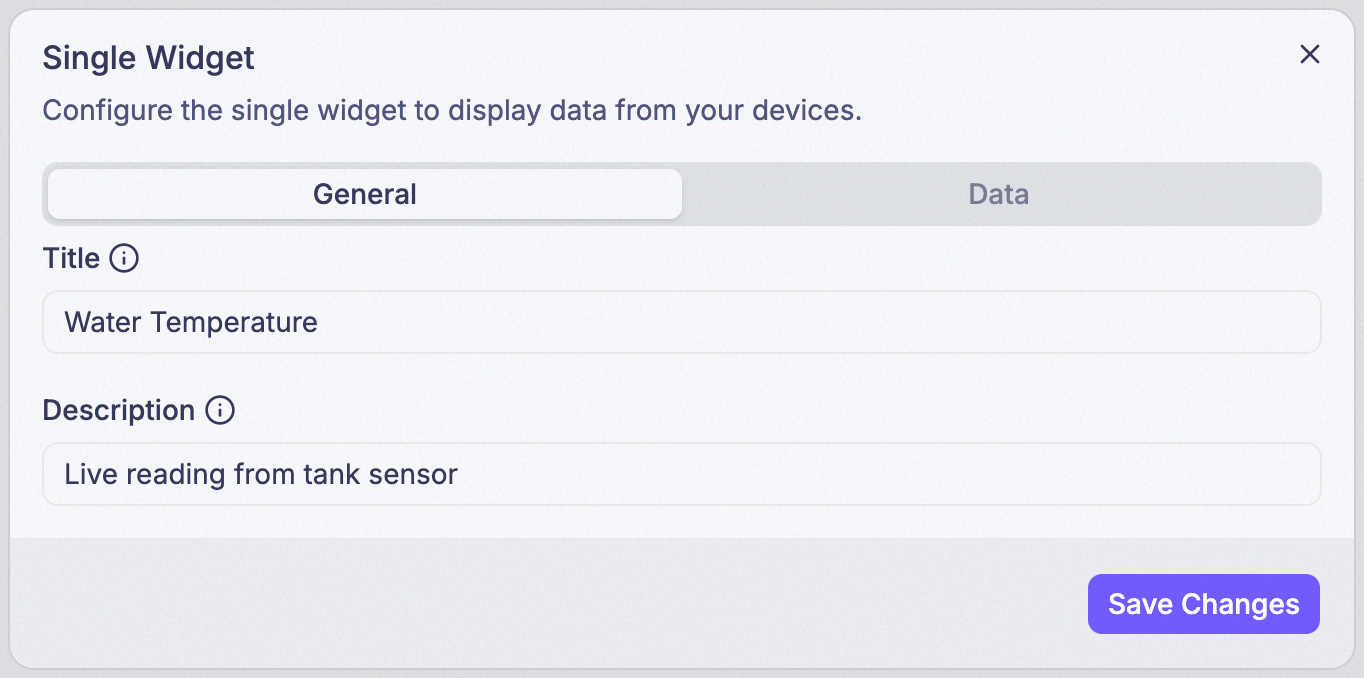
Title is what’s actually displayed as the widget’s heading. Description isn’t shown on the card at all — it only appears in a tooltip when someone hovers the info icon (ⓘ) next to the title.
Step 2: Add the Field
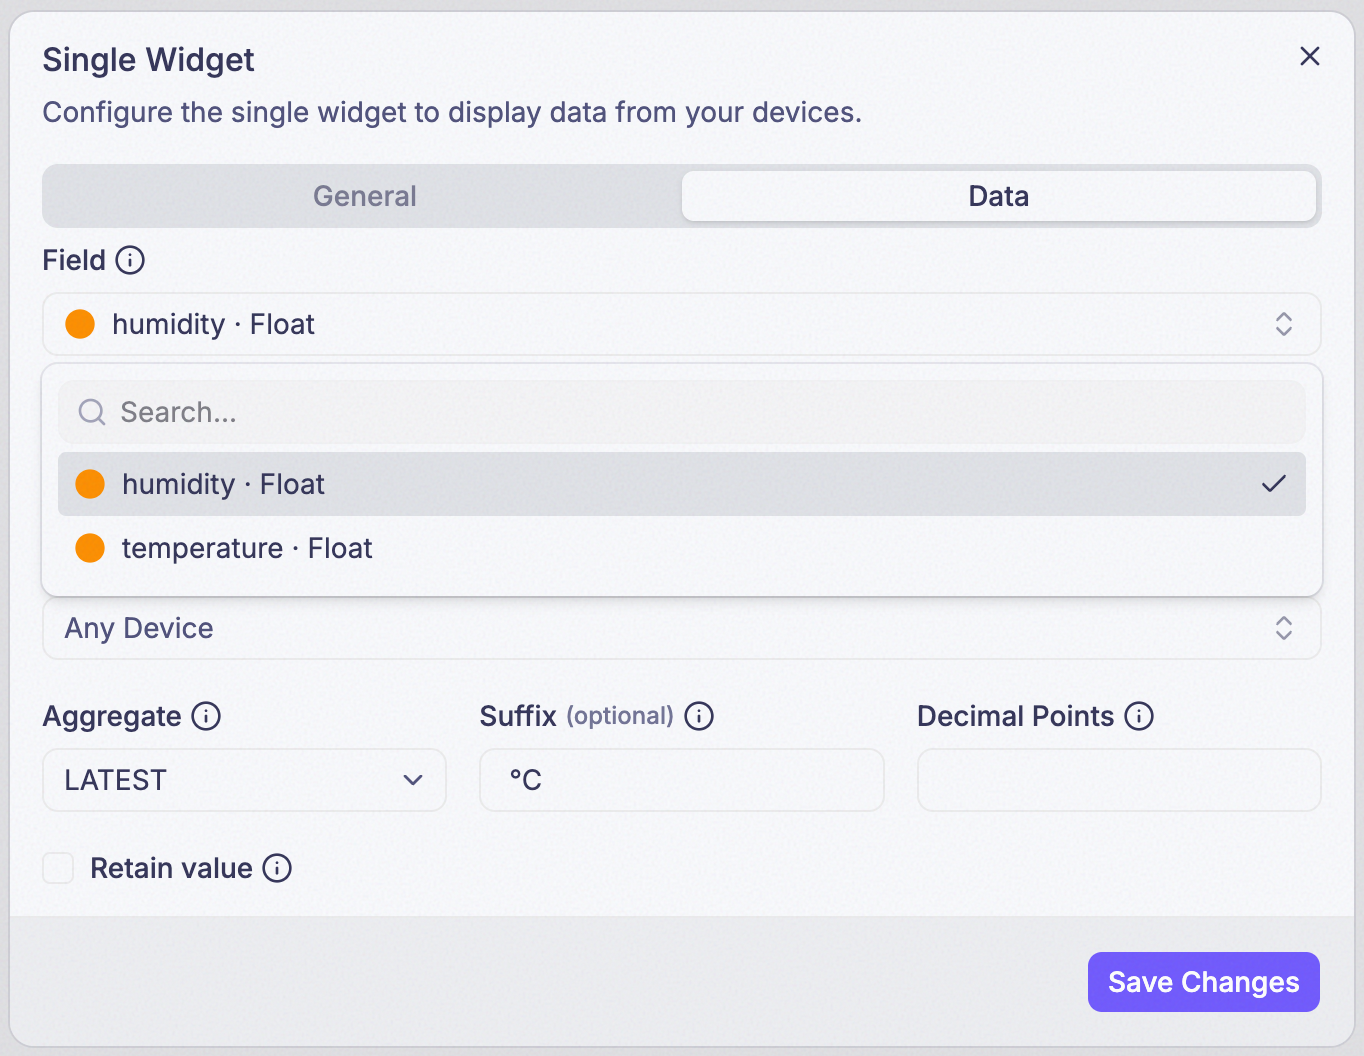
The specific reading you want (e.g., humidity, temperature). It has to already exist as a
device field — if the reading you’re looking for isn’t in this list, either
nobody has defined it yet, or no device has ever sent it, and defining the field is the fix, not
retrying this step.
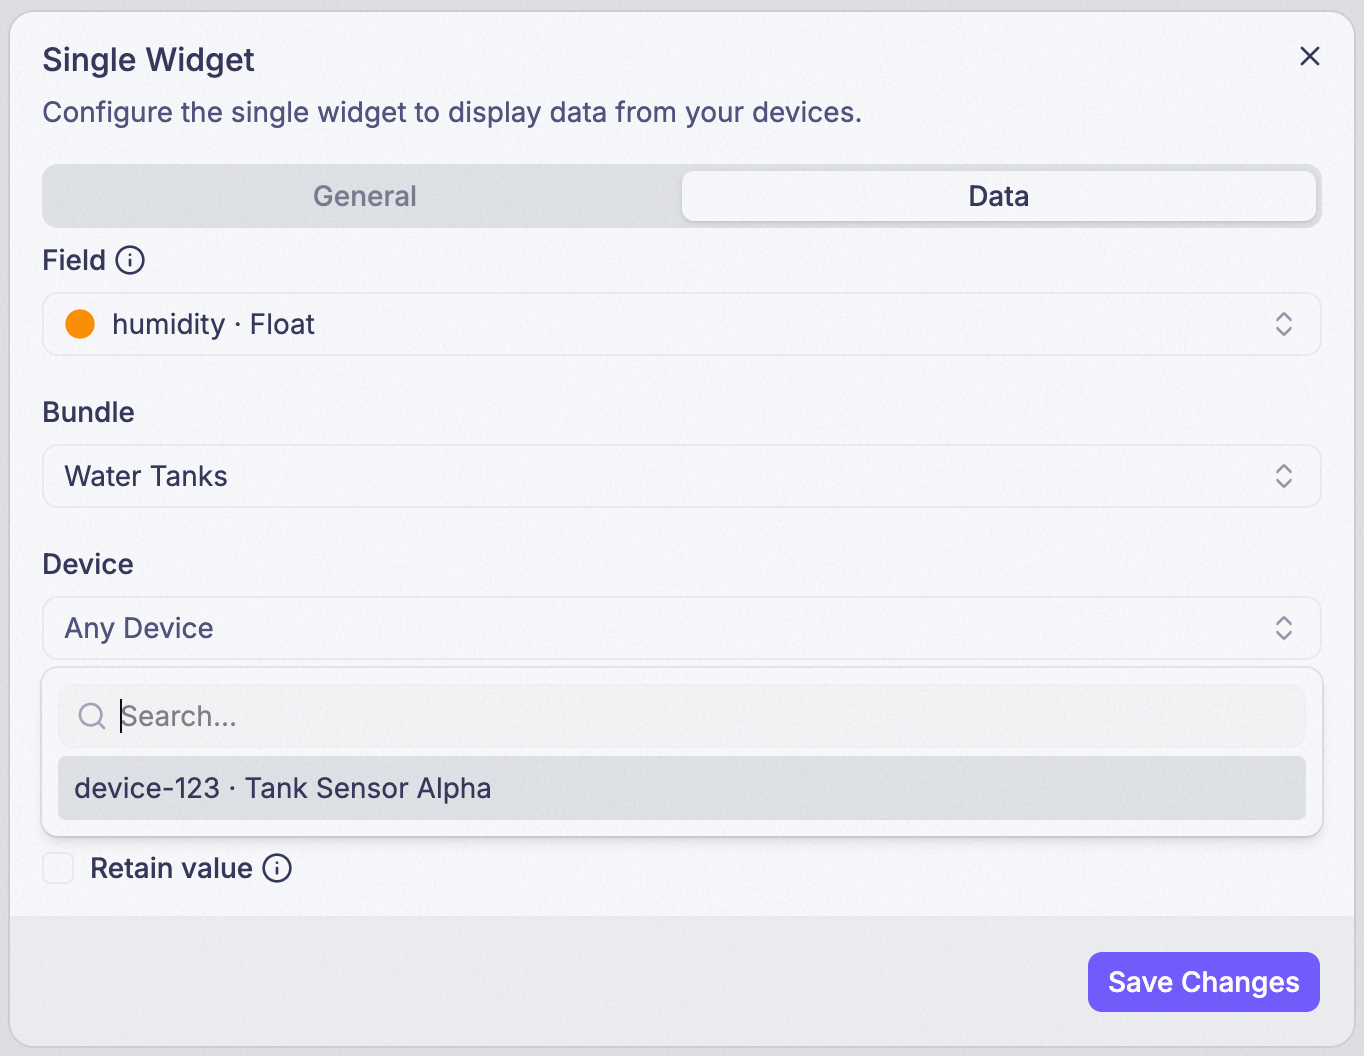
Step 3: Choose a Bundle (optional)
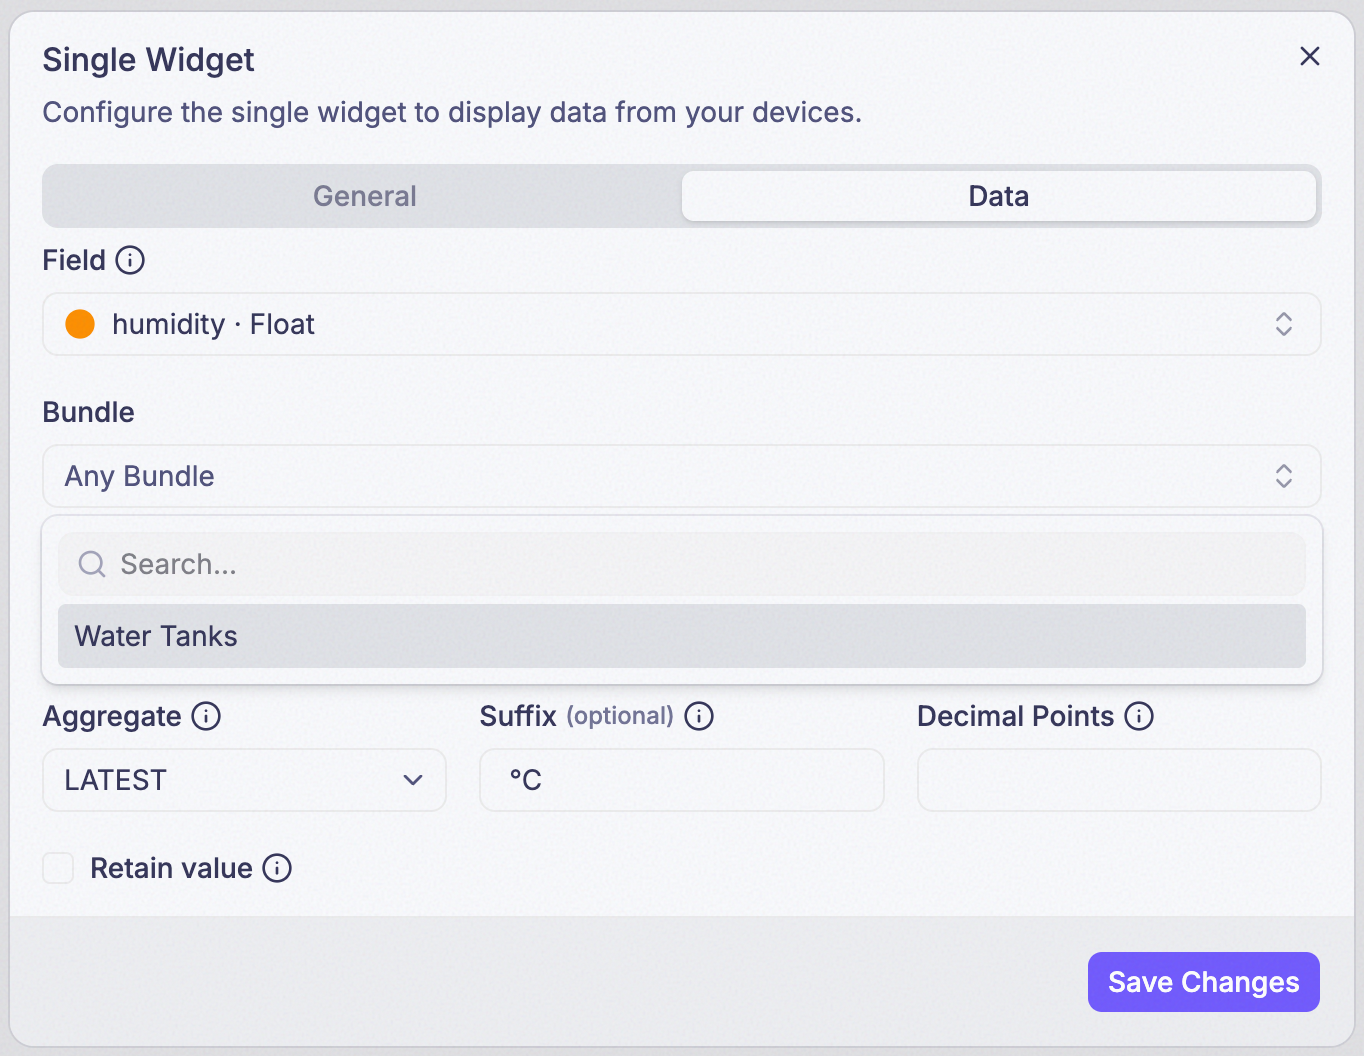
Points the widget at every device in a bundle instead of one device. Leave it blank to pick a single device instead, in the next step.
Step 4: Choose a Device (optional)
Points the widget at one specific device. Leave both Bundle and Device blank and the widget reads from any device that reports the field.
Step 5: Choose an Aggregate
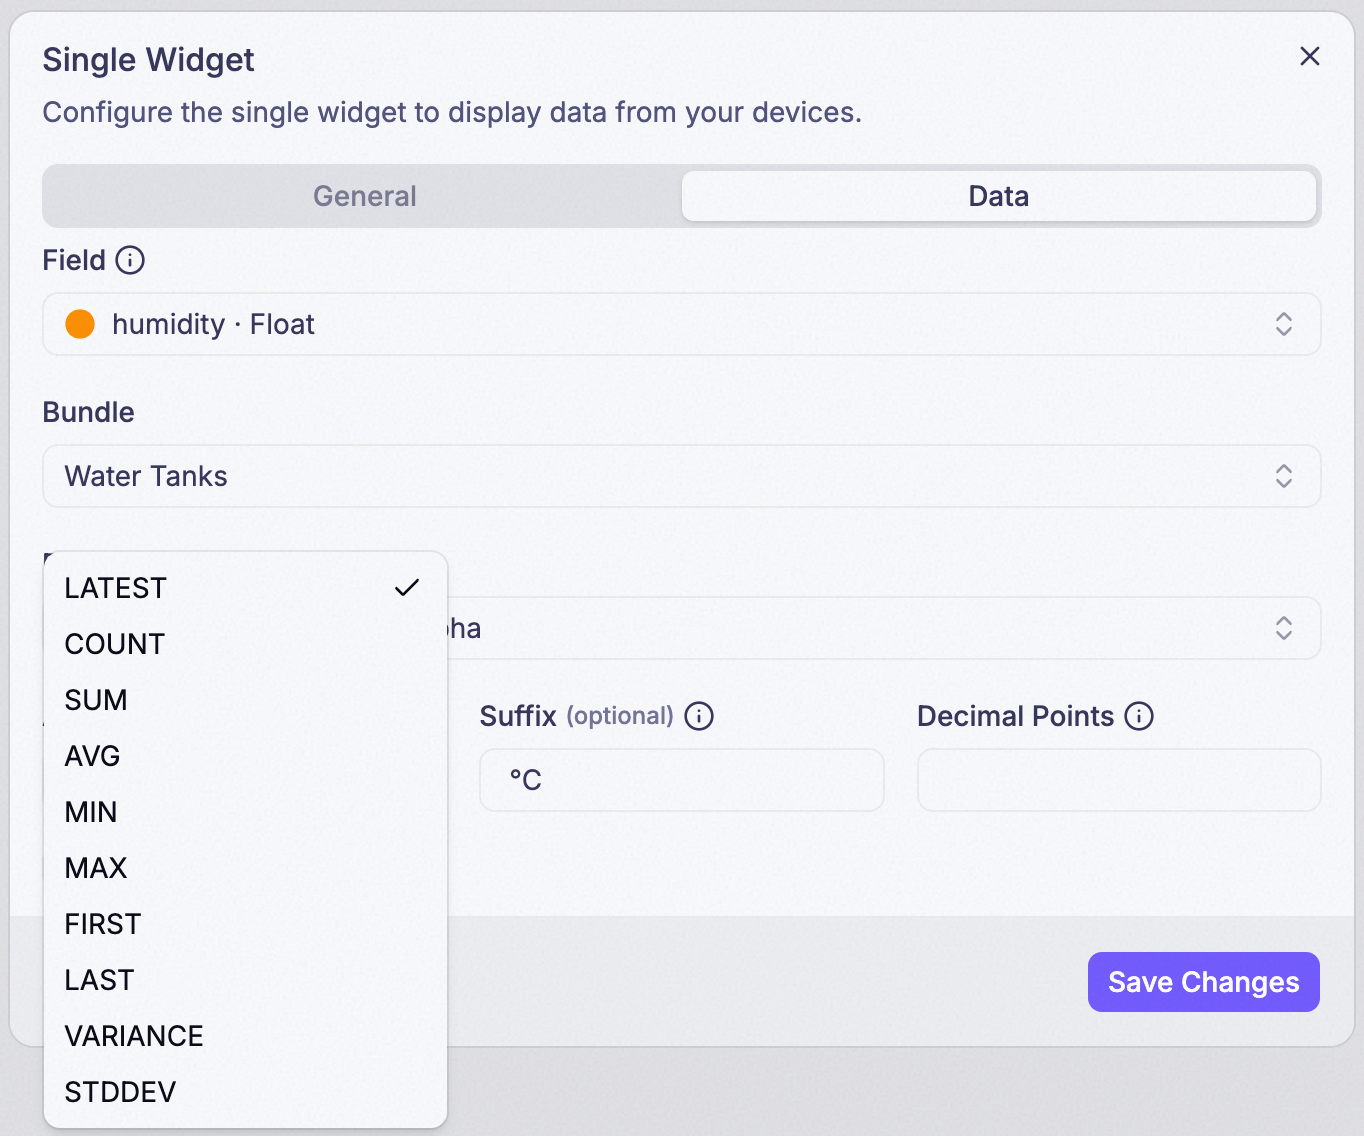
A field can report hundreds of readings inside a Time Range, but a Single Value widget only shows one number — Aggregate is how you decide which one:
| Mode | Shows |
|---|---|
LATEST | The most recent reading — ignores Time Range; see the callout below |
COUNT | How many readings arrived |
SUM | All readings added together |
AVG | The average of all readings |
MIN | The lowest reading |
MAX | The highest reading |
FIRST | The earliest reading inside the Time Range |
LAST | The most recent reading inside the Time Range |
VARIANCE | Statistical variance of the readings |
STDDEV | Standard deviation of the readings |
Picking anything other than LATEST reveals a Time Range field underneath it — every mode except
LATEST needs one to know how far back to look.
Step 6: Set Suffix, Decimal Points, and Retain
Suffix is an optional unit shown after the number (e.g., “°F”). Decimal Points takes 0 to 5, and
defaults to 2 if left blank. Retain only appears when Aggregate is LATEST — see the callout below
for what it does.
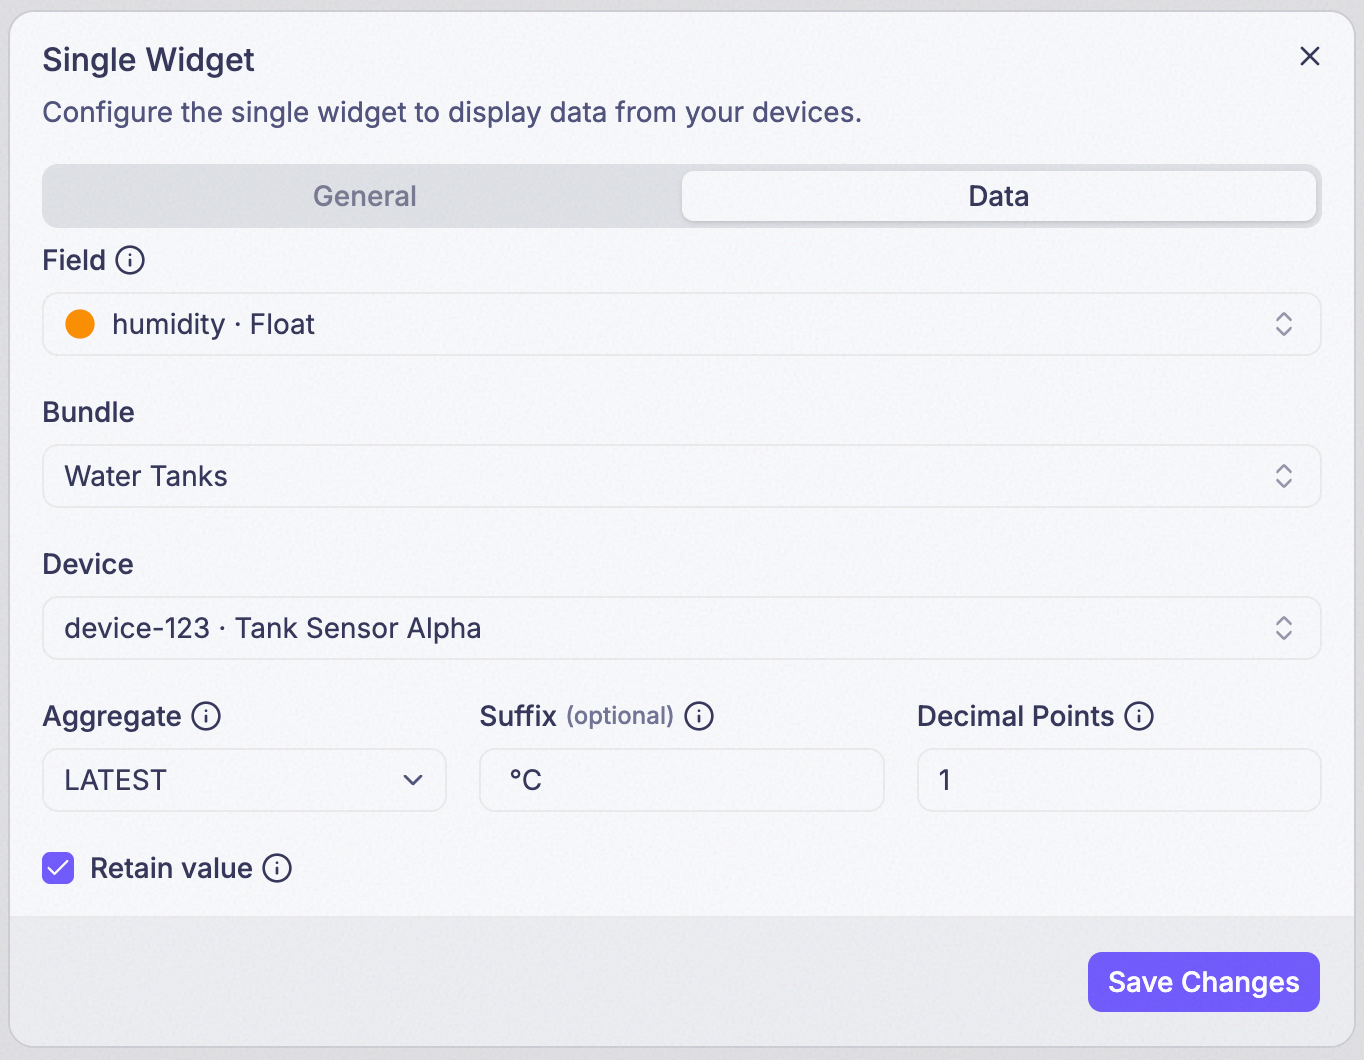
LATEST and LAST sound like the same thing and aren’t. LAST respects
whatever Time Range you set — it’s the most recent reading inside that
window, and returns nothing if the window has no data. LATEST ignores
Time Range entirely: it looks back 15 minutes on its own, or 30
days if Retain is turned on. A sensor that reports once an hour will
show blank on LATEST with Retain off — not because anything is
misconfigured, but because 15 minutes isn’t long enough to catch its next
report. Turn Retain on for anything that doesn’t report constantly. This
same 15-minute/30-day rule applies everywhere LATEST is used, including
widgets where it’s the only option — see
Boolean and
Image.
Suffix and Decimal Points only change how the number is displayed. They don’t round, convert, or otherwise touch the underlying value — switching Decimal Points from 2 to 0 doesn’t lose precision, it just stops showing it.
Example