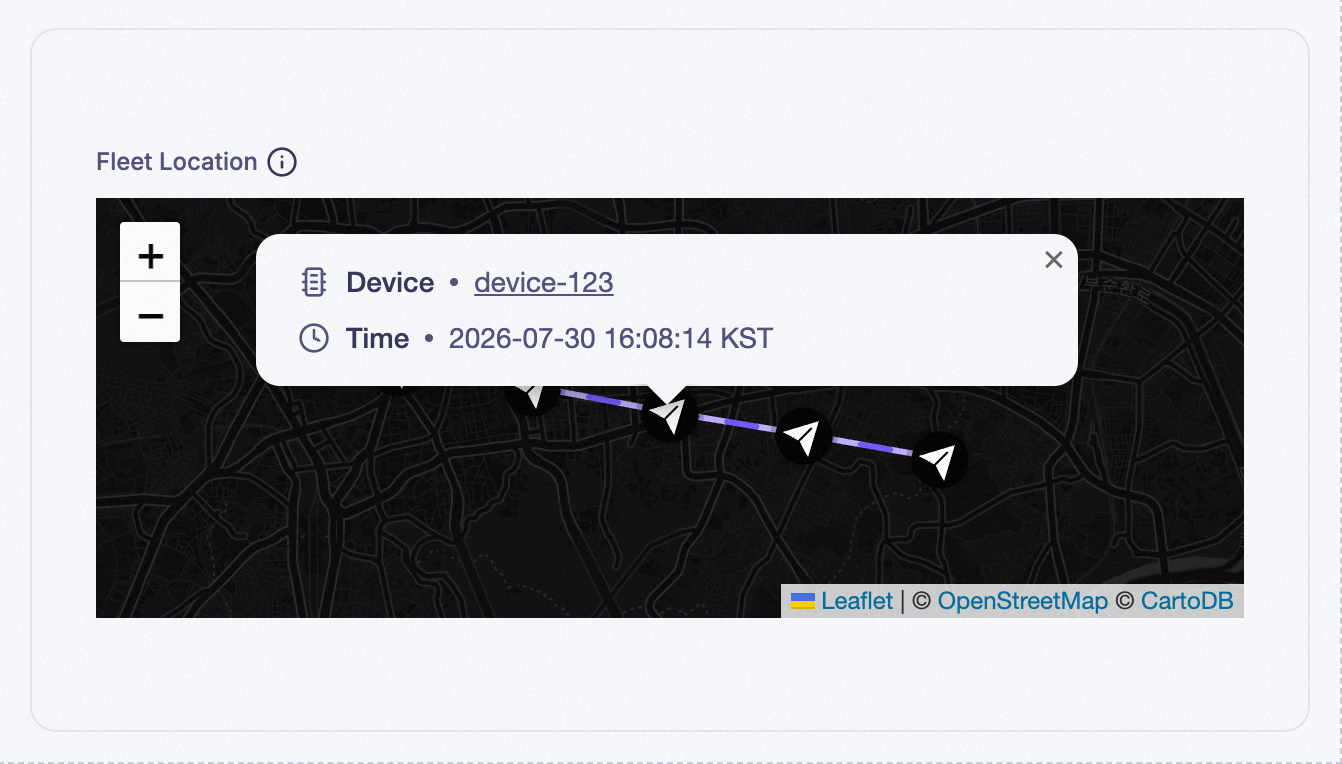
12. Map Widget
Plots a device’s reported GPS position — the widget for anything where location, not a reading, is the point. Where Image Map places readings on a picture you choose (a floor plan, a schematic), Map places them on a real-world map using coordinates a device actually reports — the right choice whenever the thing being tracked genuinely moves around, rather than sitting at a fixed spot you’ve already drawn.
- Examples:
- The current position of each vehicle in a delivery fleet.
- Where a mobile sensor was last reported from.
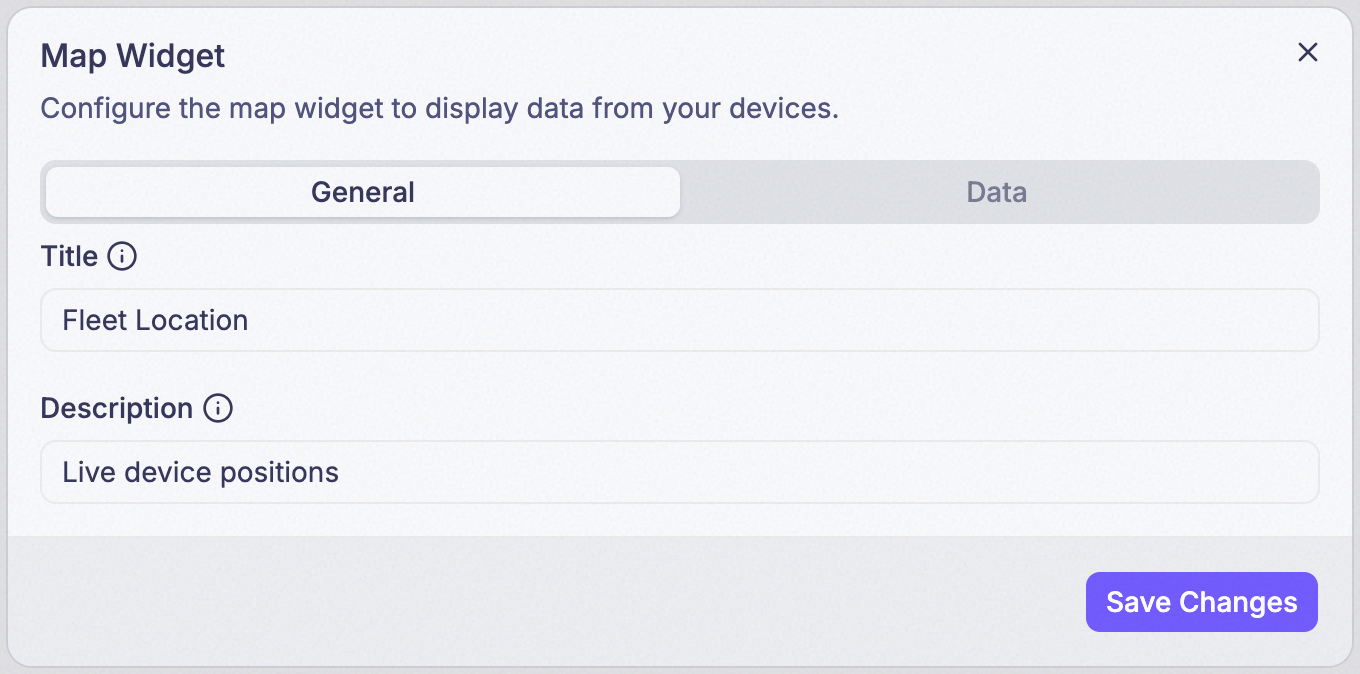
Step 1: Set Title and Description
Title is what’s actually displayed as the widget’s heading. Description isn’t shown on the card at all — it only appears in a tooltip when someone hovers the info icon (ⓘ) next to the title.
Step 2: Add Latitude Field, Longitude Field, and Radius Field
Latitude Field / Longitude Field are both required, and only numeric fields can be picked. Radius Field (optional) draws each marker as a sized circle instead of a plain pin — useful for showing a magnitude (like signal strength) at each location. Bundle / Device work the same as other widgets — a bundle plots one marker per device.
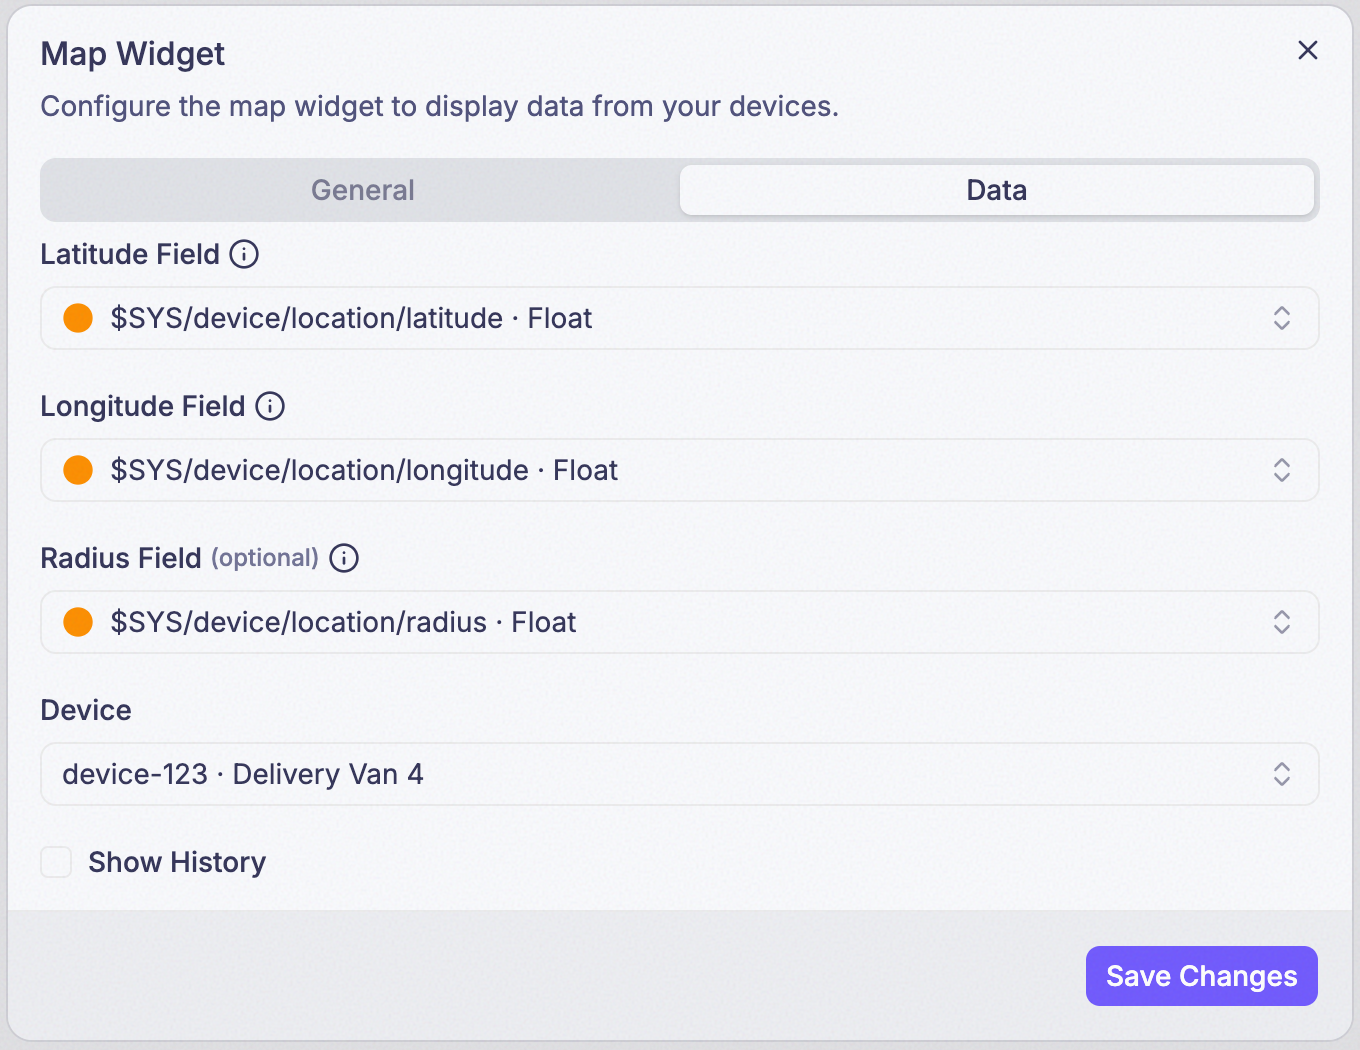
Step 3: Turn on Show History (optional)
Only appears once a specific Device is chosen — leave Device blank (whether or not a Bundle is set) and there’s no Show History control at all, since a path only makes sense for one device at a time. Off by default. With it off, the widget shows only each device’s latest position and has no Time Range setting.
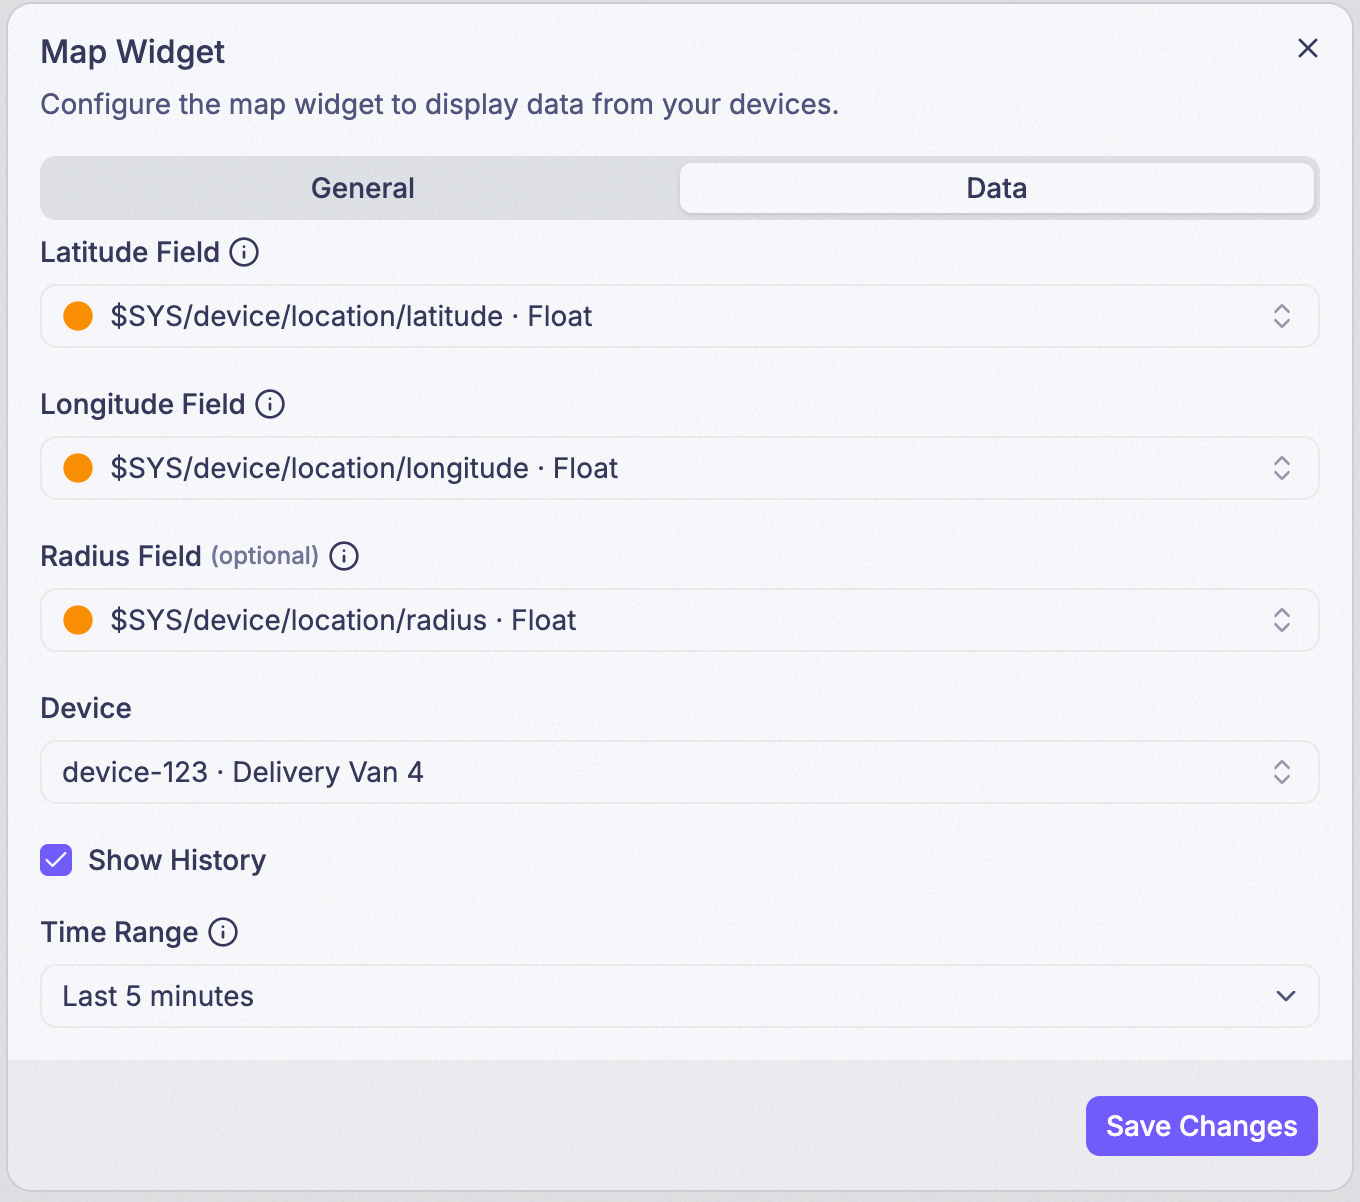
Step 4: Set Time Range
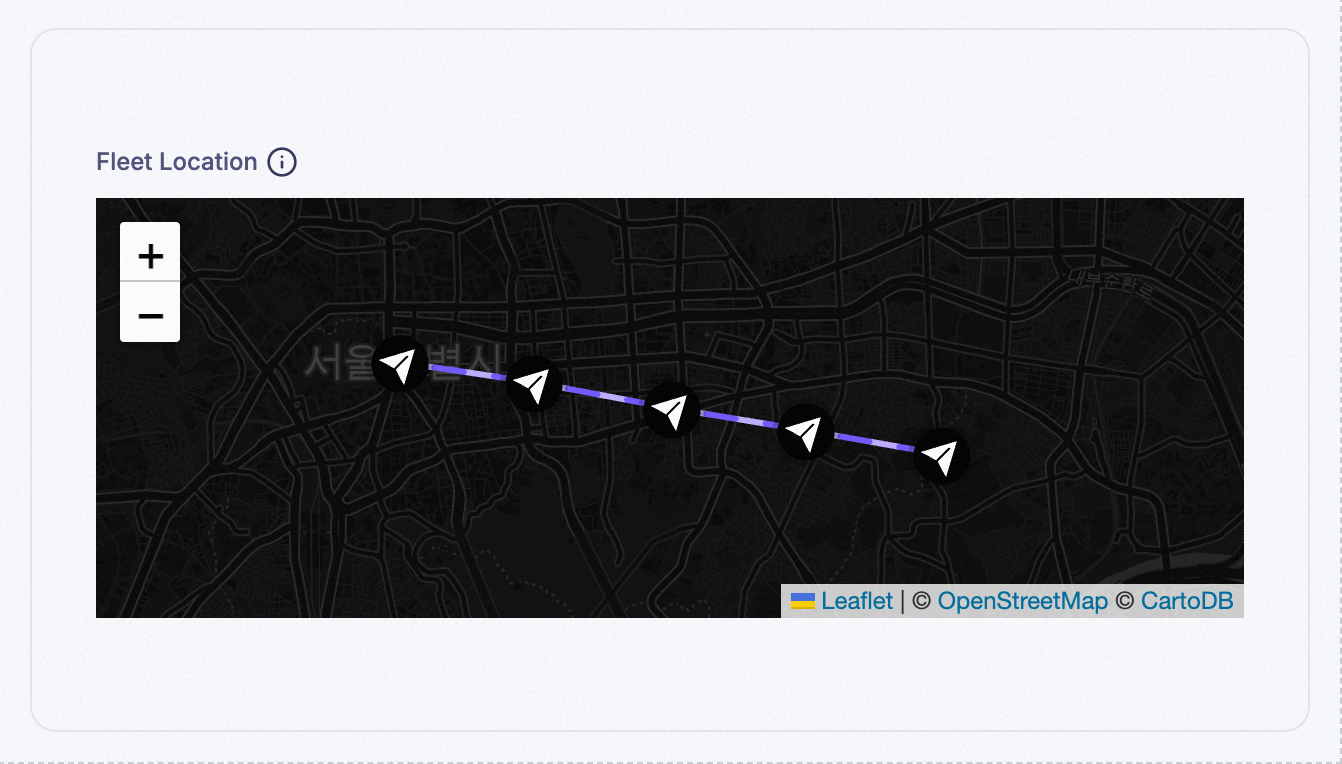
Only appears once Show History is turned on. It draws a path connecting every position recorded across that window, instead of just the last one.
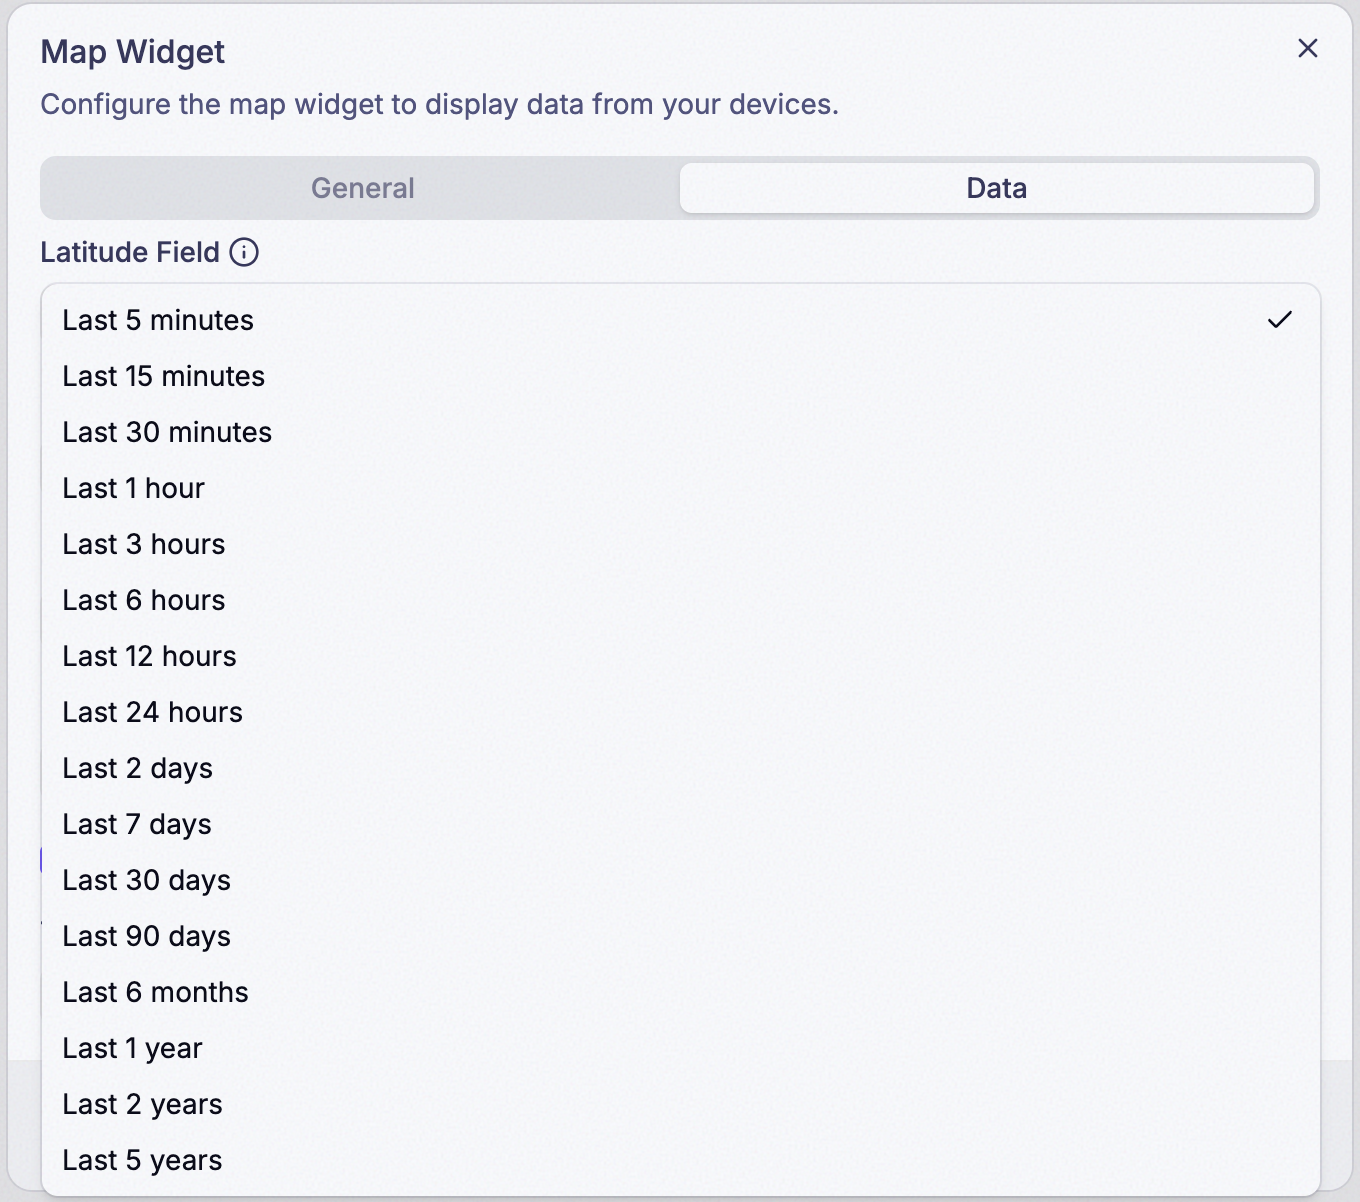
There’s no Aggregate setting to pick here in either mode — with History off, the widget always uses each device’s most recent lat/lon/radius reading. A marker (or path) needs Latitude and Longitude to both have reported in the relevant window; a device that’s only ever sent one of the two doesn’t get a marker.
Example
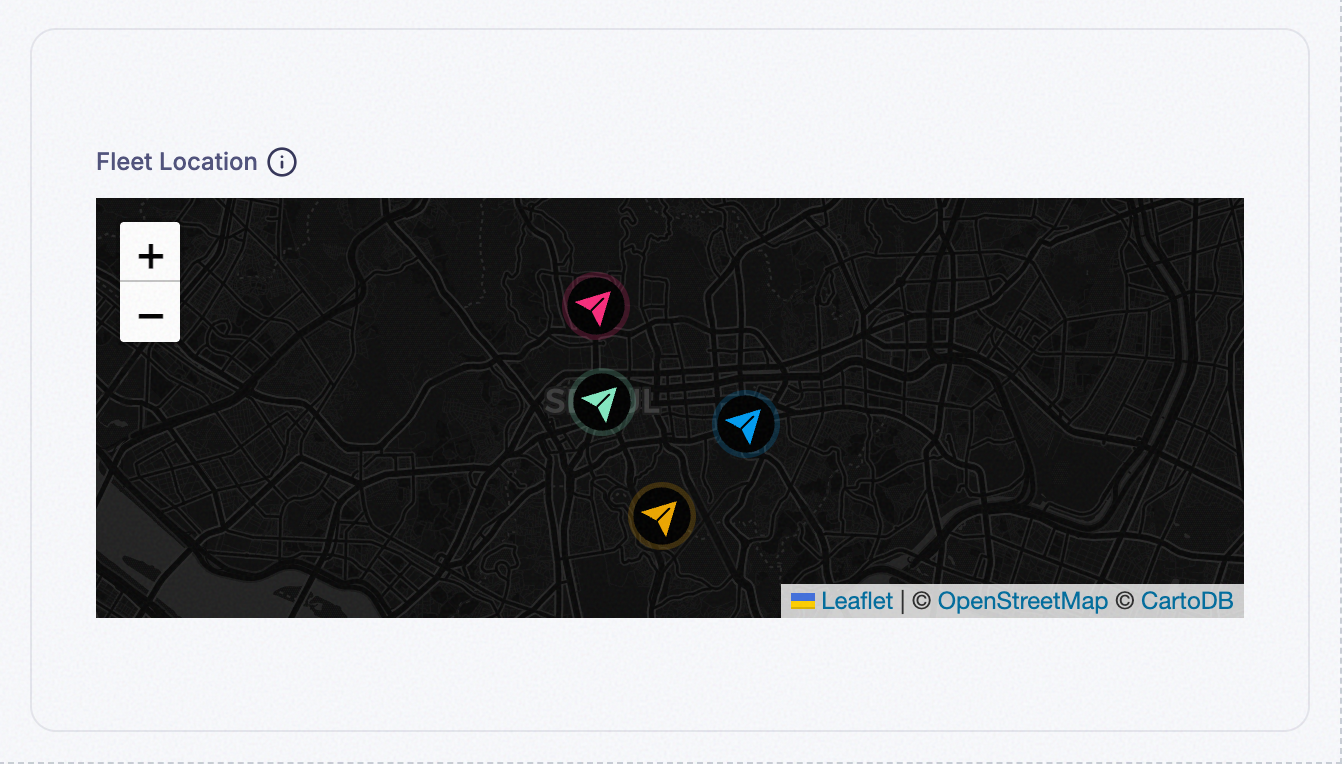
Every marker is colored by the device’s connection status:
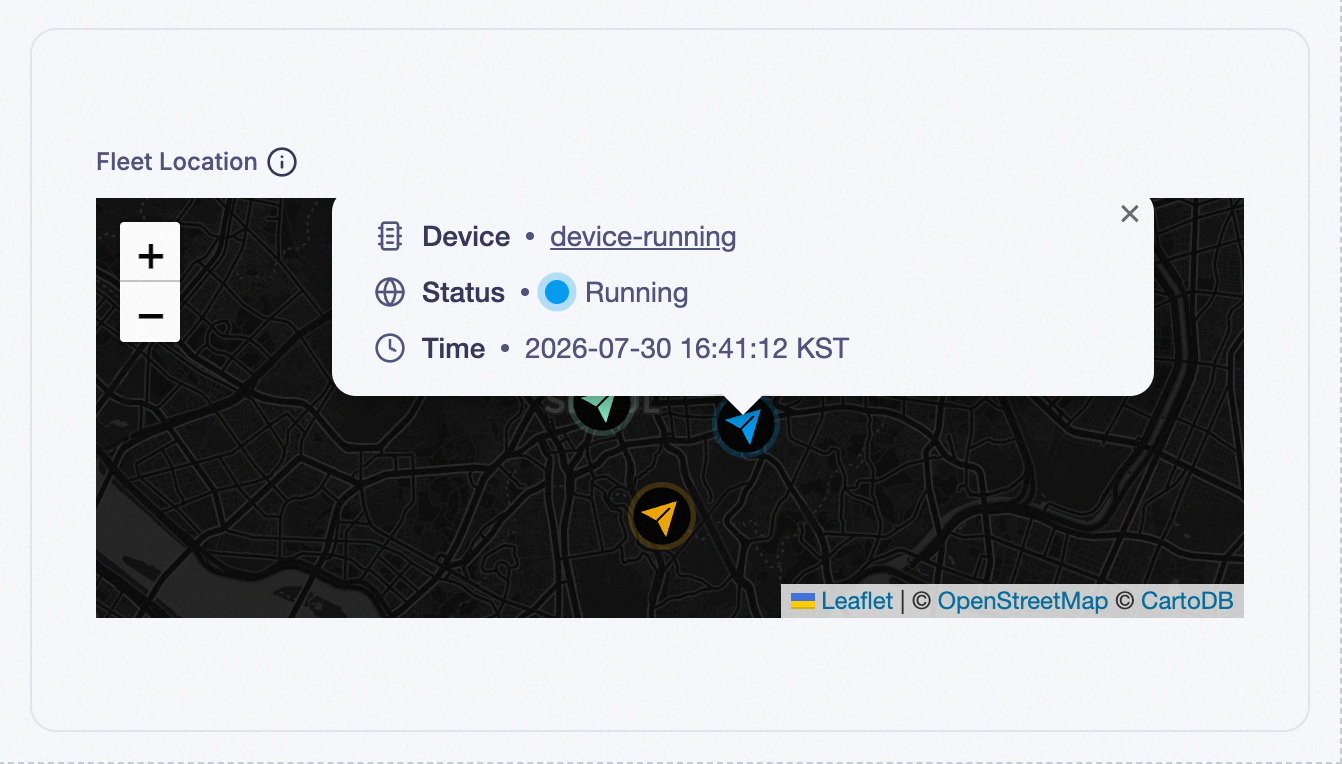
Hovering a marker shows that device’s ID, status, and the time of the plotted reading:
With Show History on, a path connects every position recorded across the Time Range:
Hovering a point along that history shows the same device information: