4. Gauge Widget
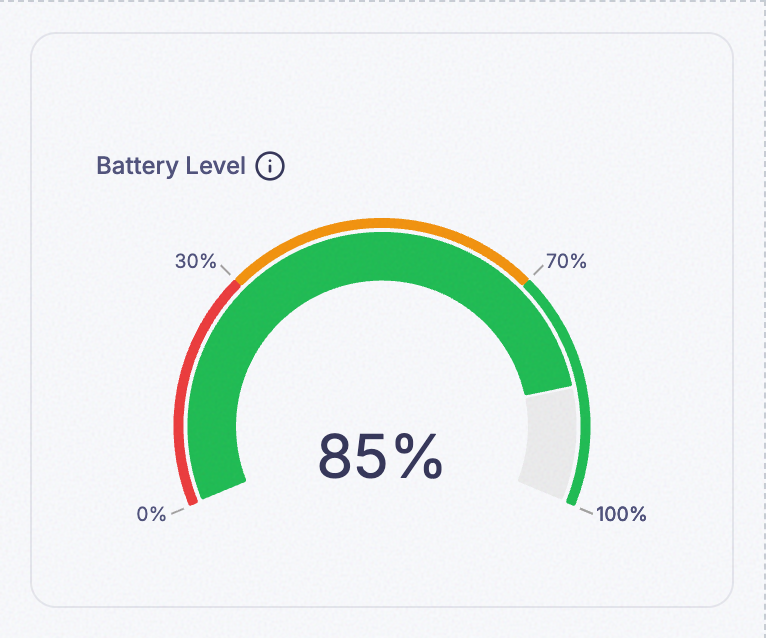
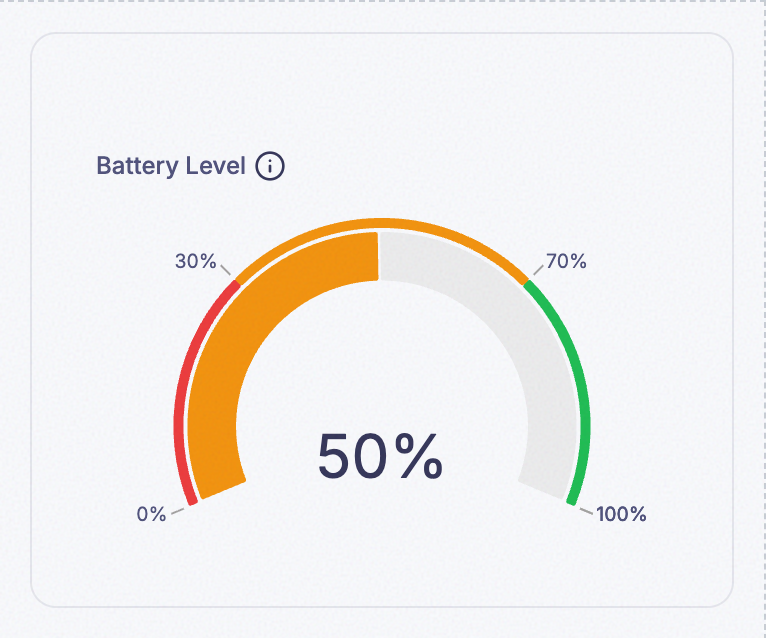
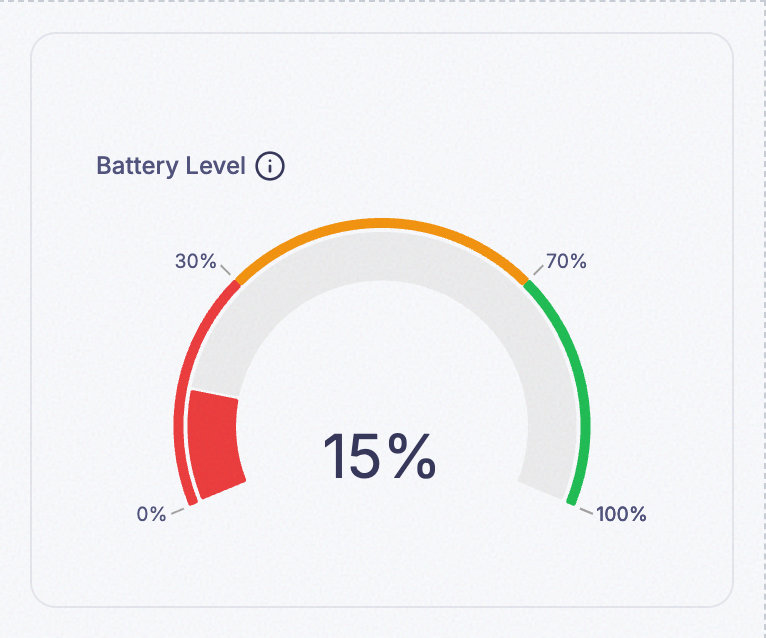
Shows one value as a position on a scale, with color-coded zones instead of a single color/label pair. Where the State widget gives you a label, the Gauge widget gives you a dial — it answers “how close to the limit is this” as much as “what state is this in,” which makes it the better fit for anything with a hard ceiling or floor, like pressure, fill level, or remaining capacity, where how far from the edge matters as much as which zone you’re in.
- Examples:
- A gauge showing current machine pressure from 0 to 100 PSI, with green, yellow, and red zones.
- A gauge showing tank fill level against its capacity.
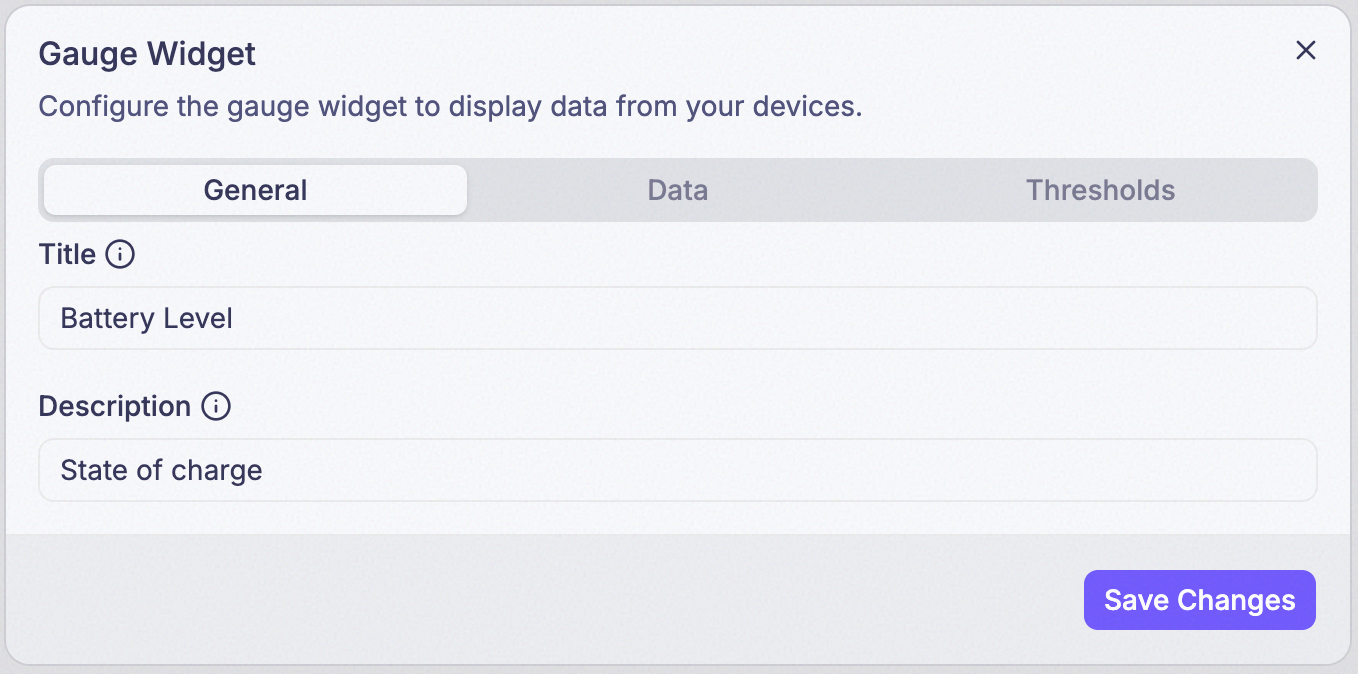
Step 1: Set Title and Description
Title is what’s actually displayed as the widget’s heading. Description isn’t shown on the card at all — it only appears in a tooltip when someone hovers the info icon (ⓘ) next to the title.
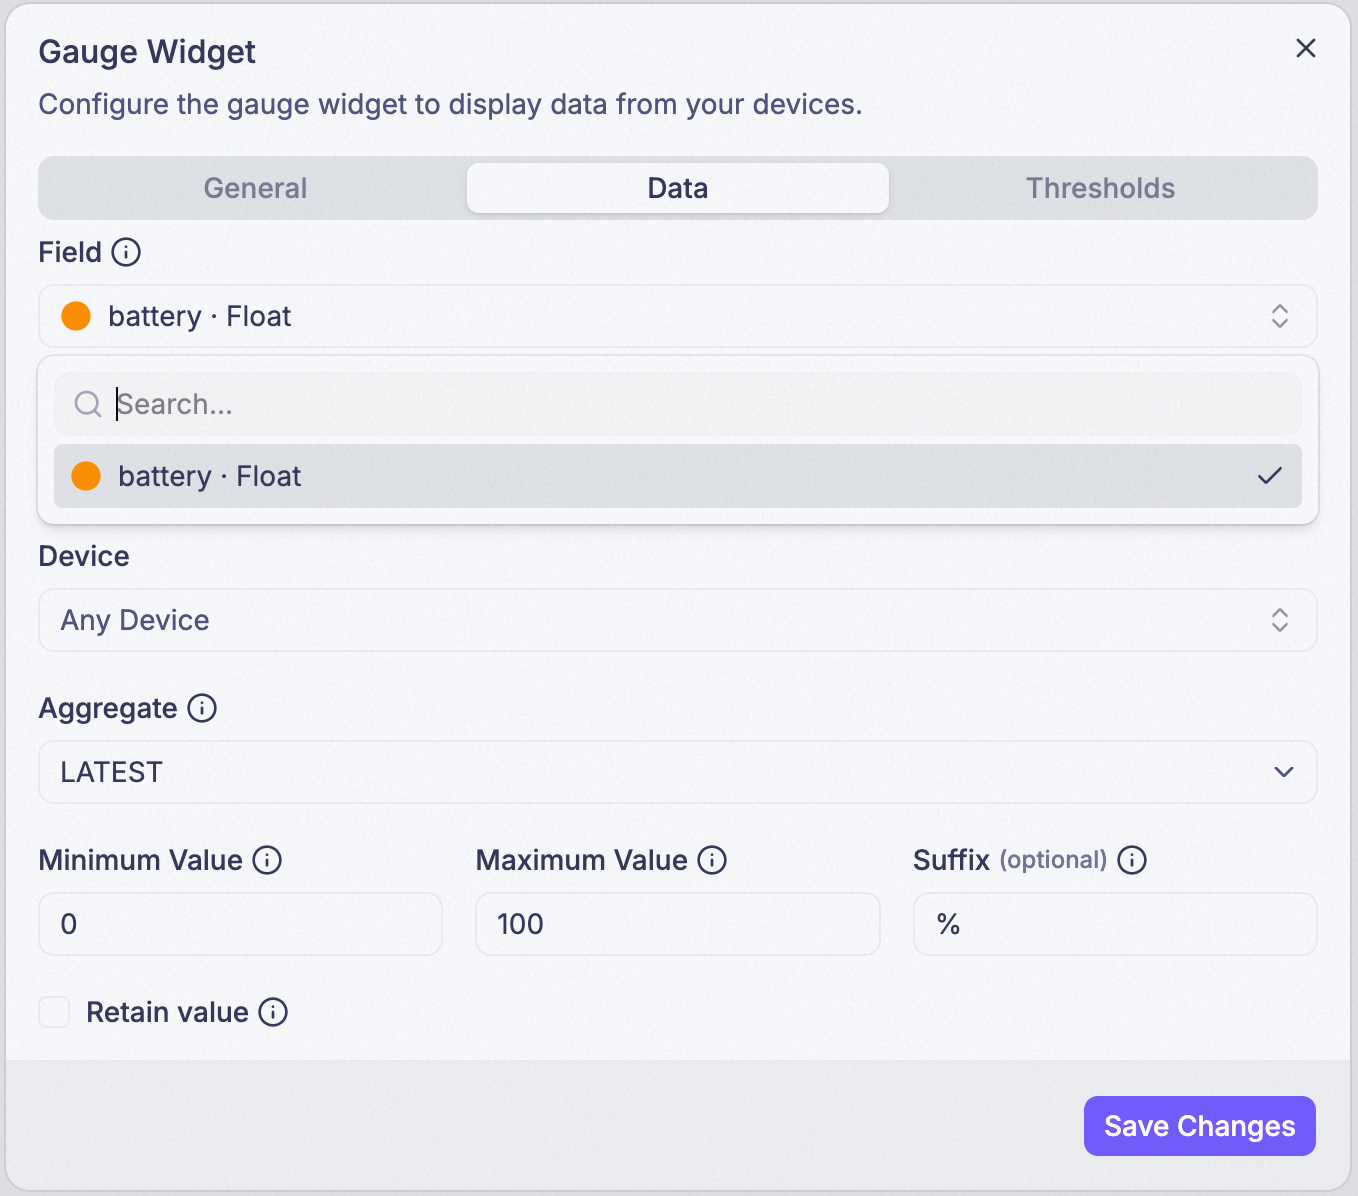
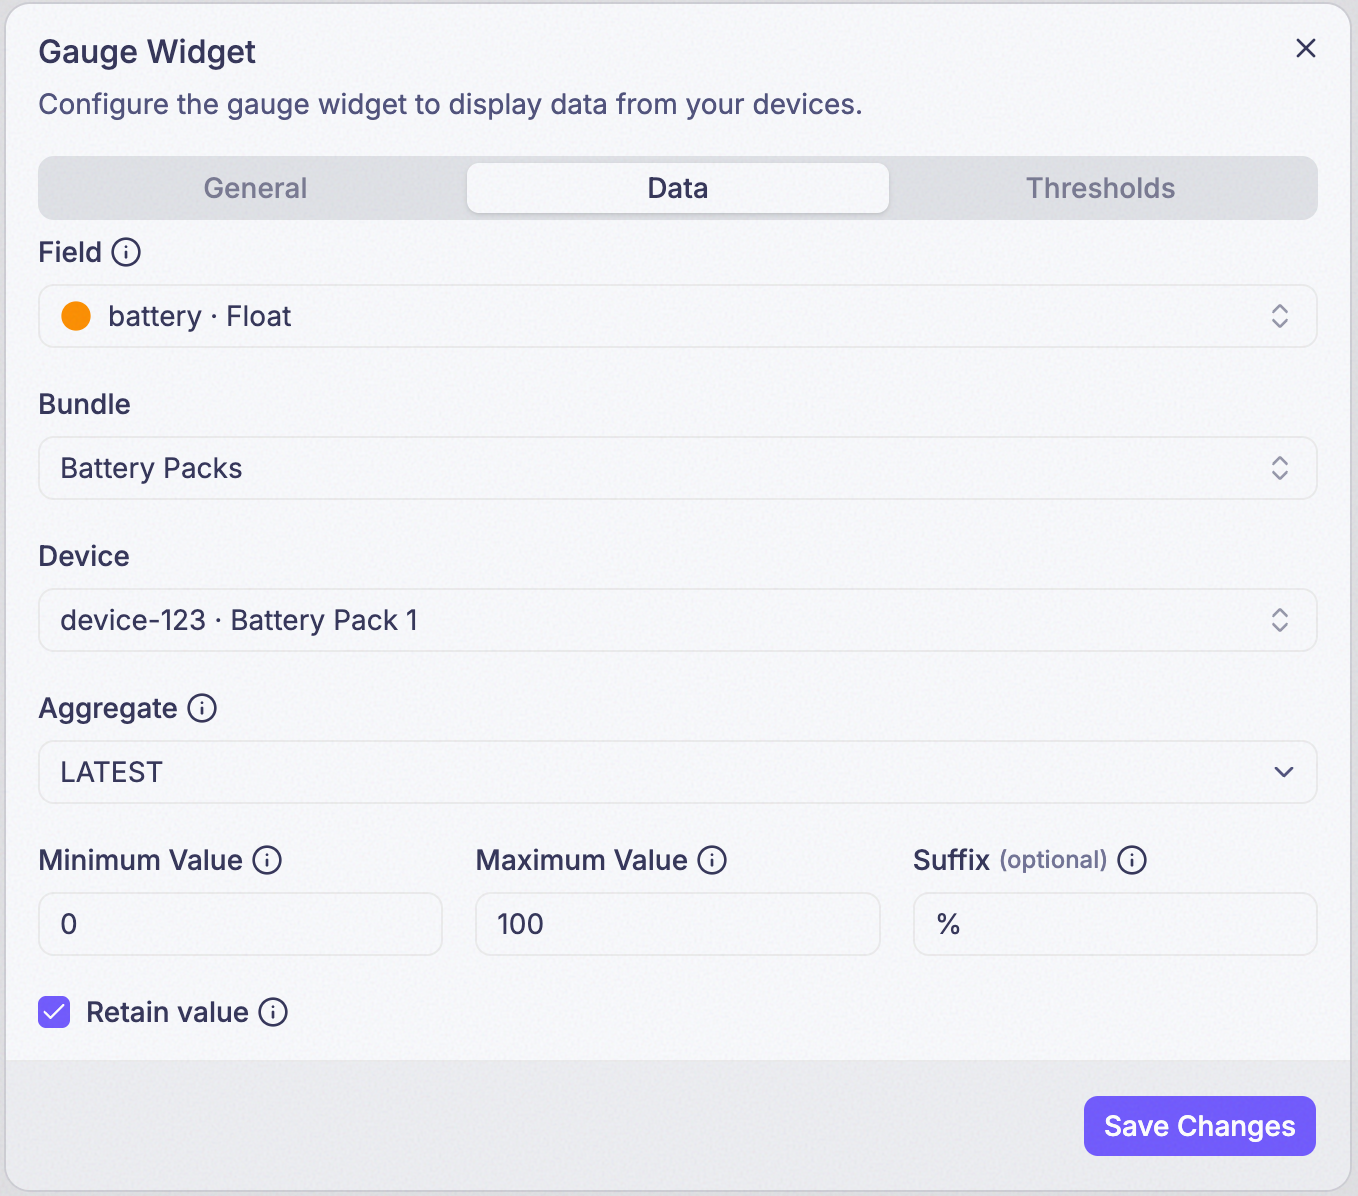
Step 2: Add the Field
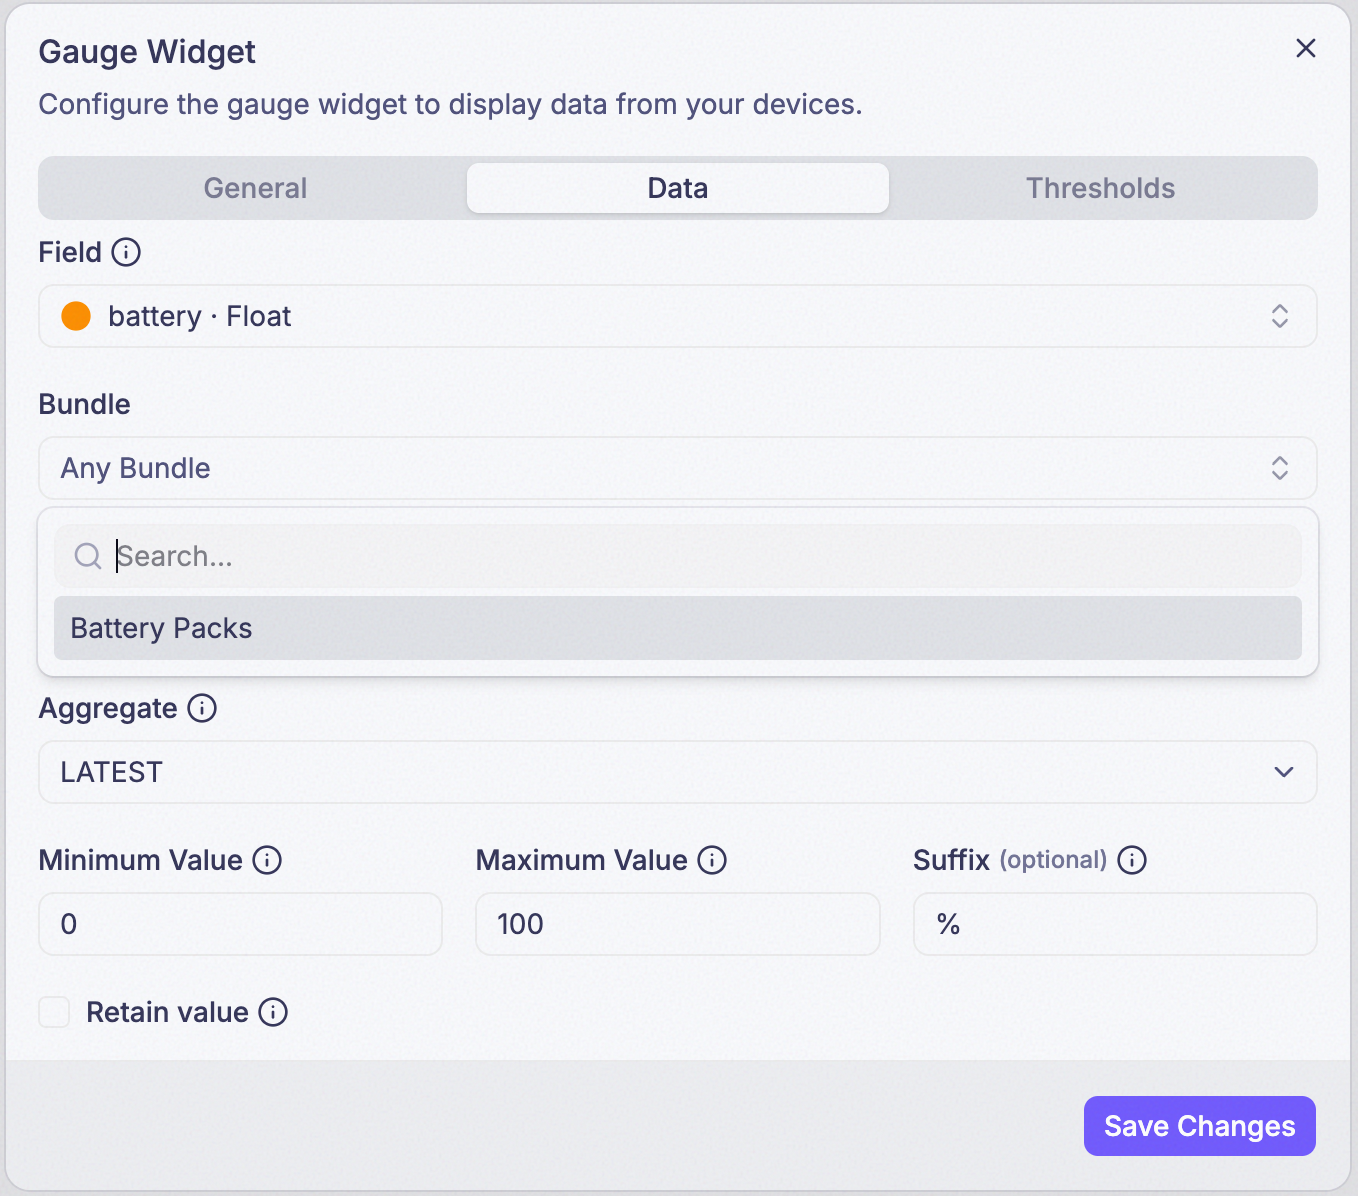
Step 3: Choose a Bundle (optional)
Points the widget at every device in a bundle instead of one device. Leave it blank to pick a single device instead, in the next step.
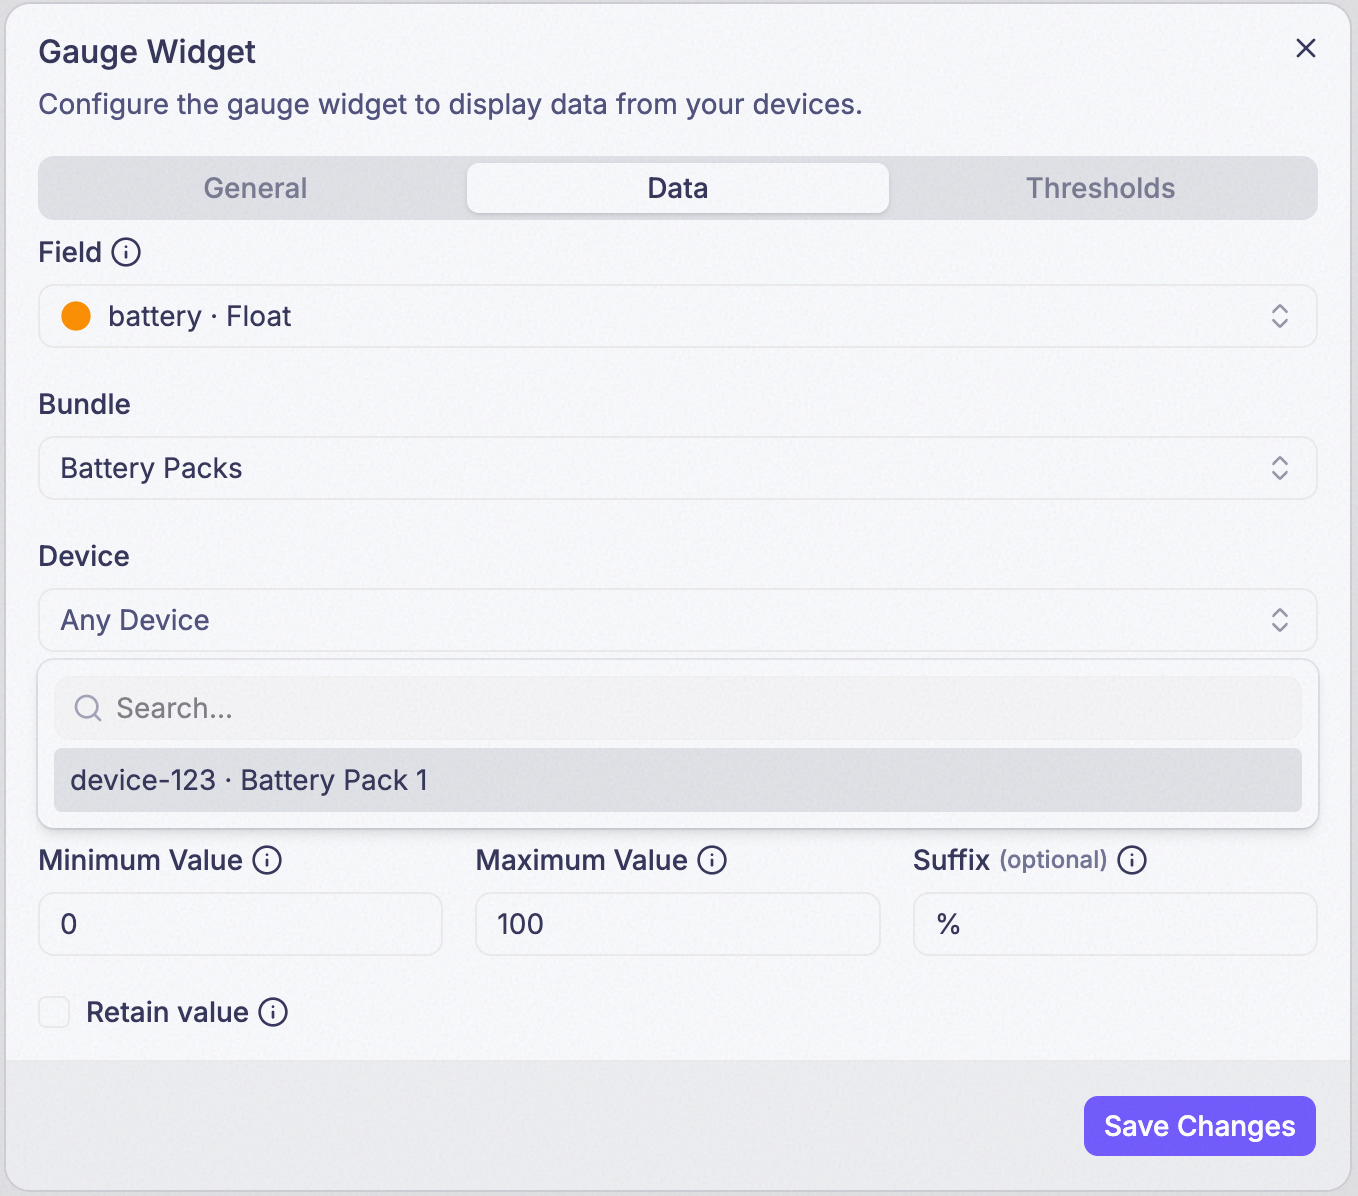
Step 4: Choose a Device (optional)
Points the widget at one specific device. Leave both Bundle and Device blank and the widget reads from any device that reports the field.
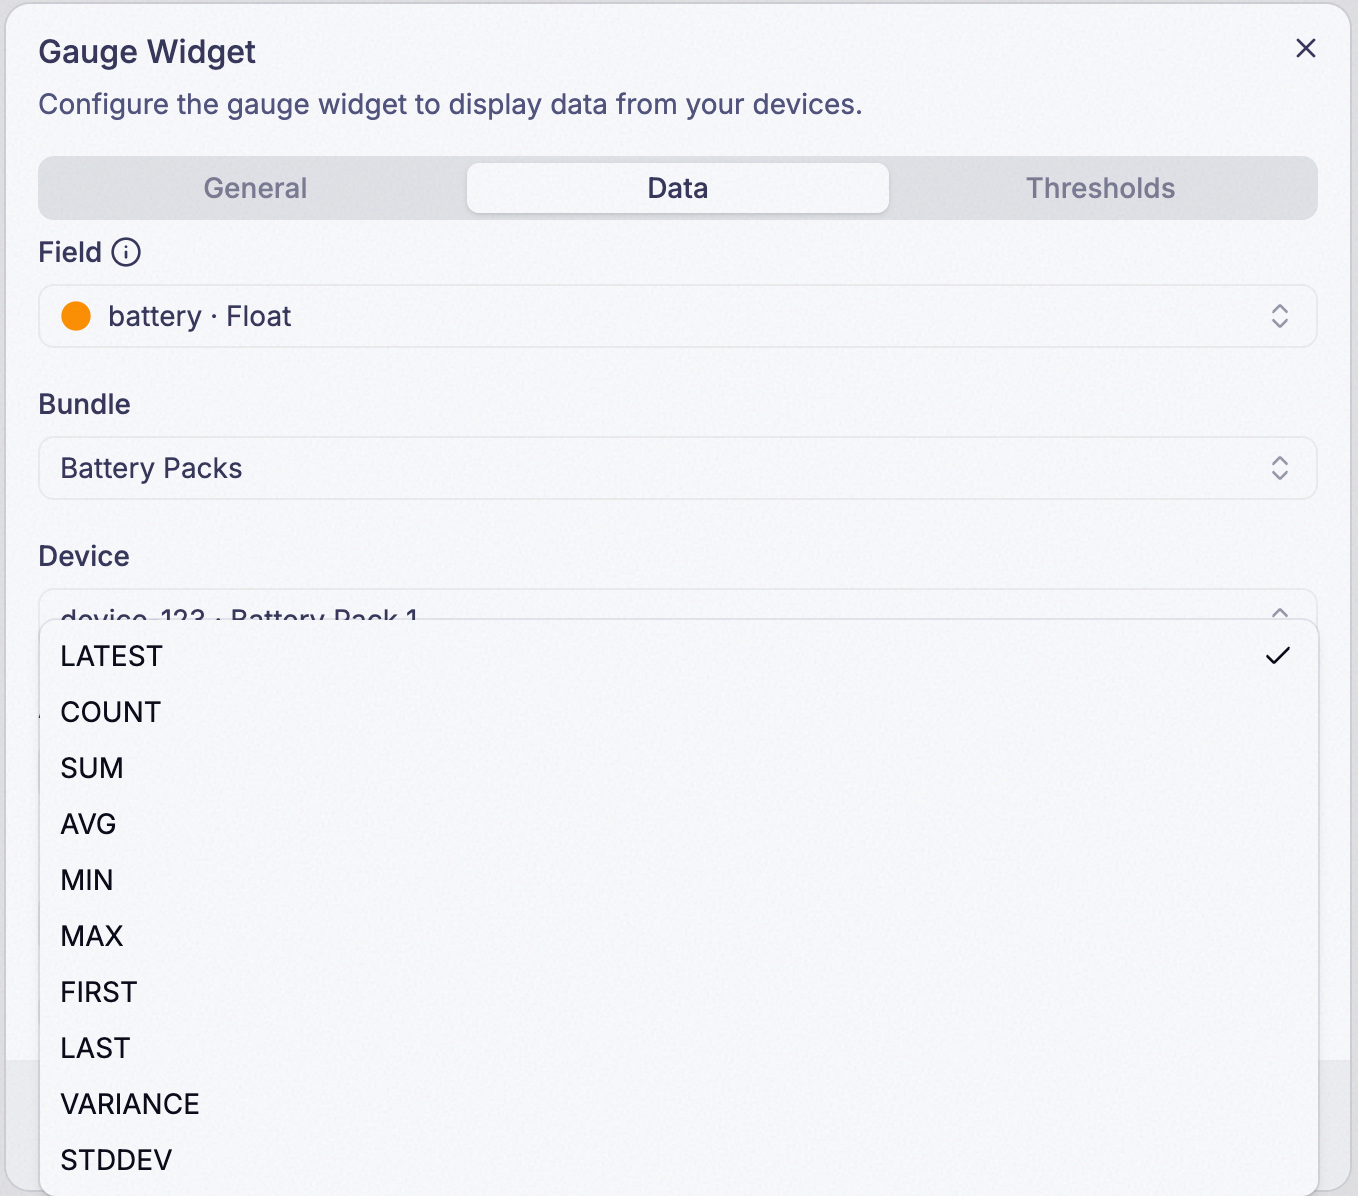
Step 5: Choose an Aggregate
Aggregate decides which single number the dial points at:
| Mode | Shows |
|---|---|
LATEST | The most recent reading — ignores Time Range; see the callout below |
COUNT | How many readings arrived |
SUM | All readings added together |
AVG | The average of all readings |
MIN | The lowest reading |
MAX | The highest reading |
FIRST | The earliest reading inside the Time Range |
LAST | The most recent reading inside the Time Range |
VARIANCE | Statistical variance of the readings |
STDDEV | Standard deviation of the readings |
Picking anything other than LATEST reveals a Time Range field underneath it.
Step 6: Set Minimum Value, Maximum Value, Suffix, and Retain
Minimum Value / Maximum Value are the start and end of the gauge’s scale — Maximum must be greater
than Minimum. Suffix is an optional unit shown next to the value. Retain only appears when
Aggregate is LATEST; see the callout below for what it does.
Step 7: Add a threshold
Every threshold gets a Value and a Color — no Label, unlike State’s states, since the dial itself is the label here. The lowest threshold’s Value must exactly equal Minimum Value — it’s the floor the rest of the scale builds on.
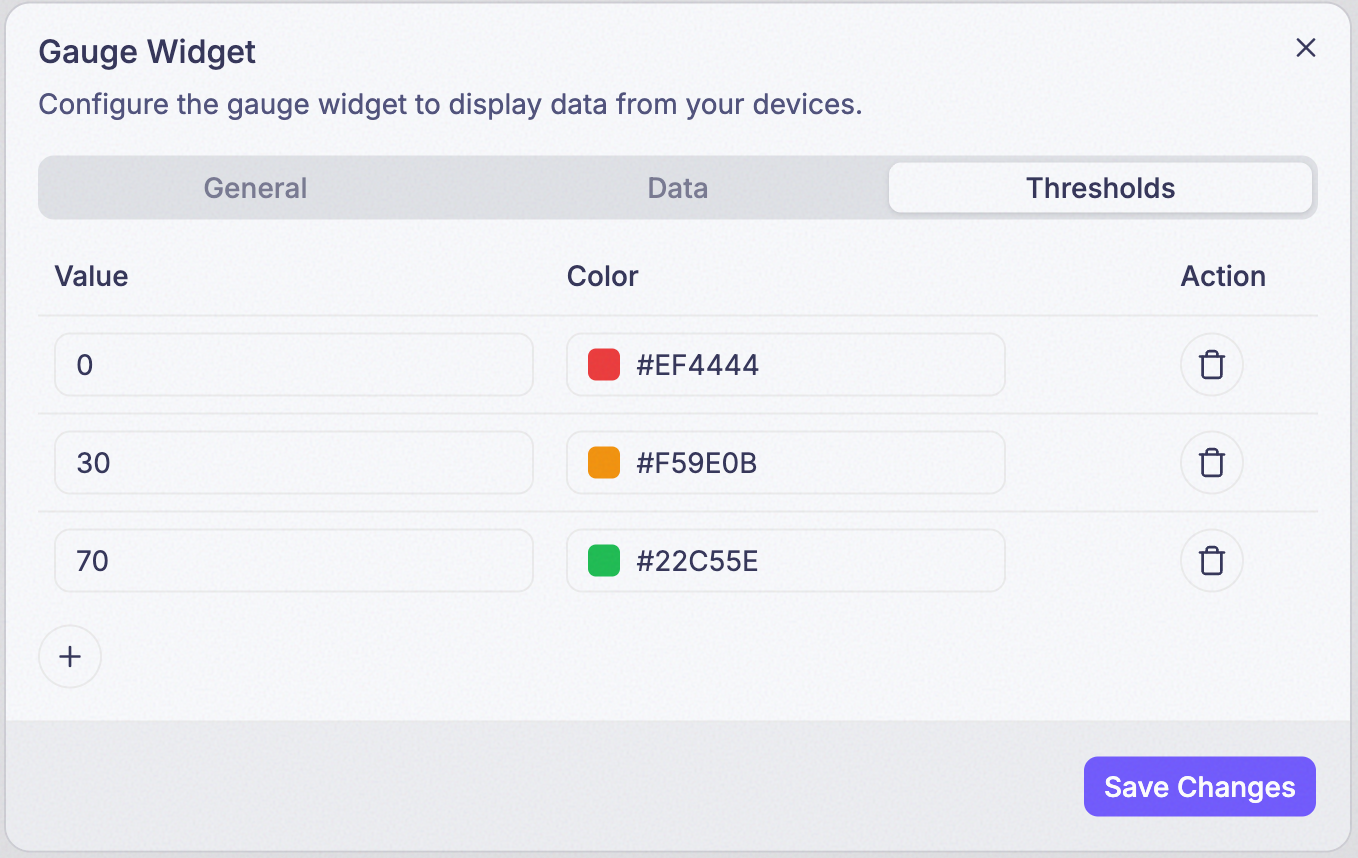
Step 8: Add another threshold
Each later threshold must be greater than the one before it and less than Maximum Value. A threshold colors everything from its own Value up to (but not including) the next one — the same rule as State widget states, worked through on the State Widget page.
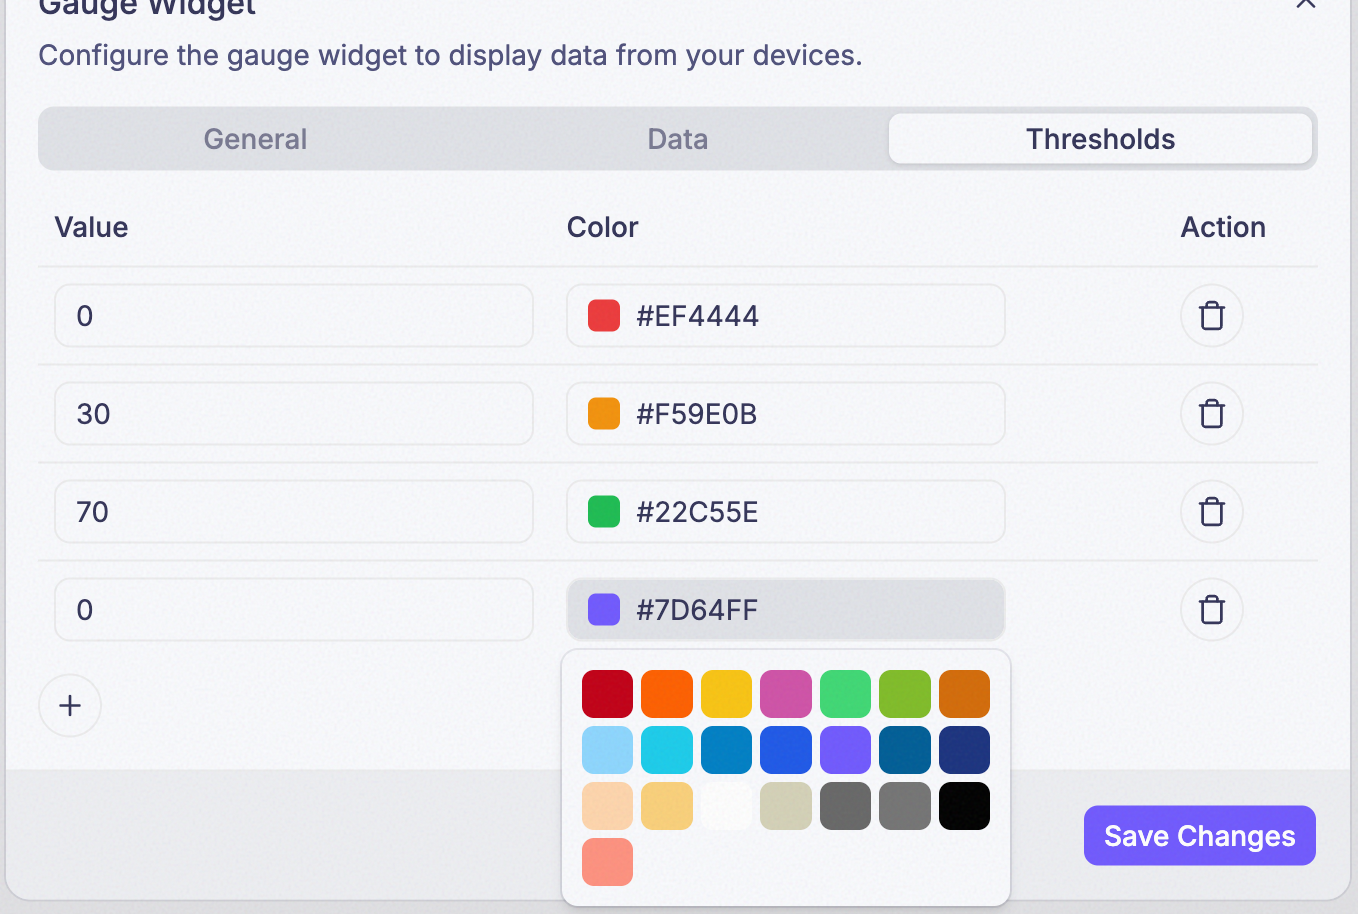
Every Gauge renders as a radial (speedometer-style) dial today — there’s no fill/bar style or percentage-display option to switch on in the editor, whatever you may have heard or seen elsewhere.
LATEST and LAST sound like the same thing and aren’t. LAST respects
whatever Time Range you set; LATEST ignores Time Range entirely and
looks back 15 minutes on its own (30 days with Retain on). See the
full explanation on the Single Value
Widget page.
Example