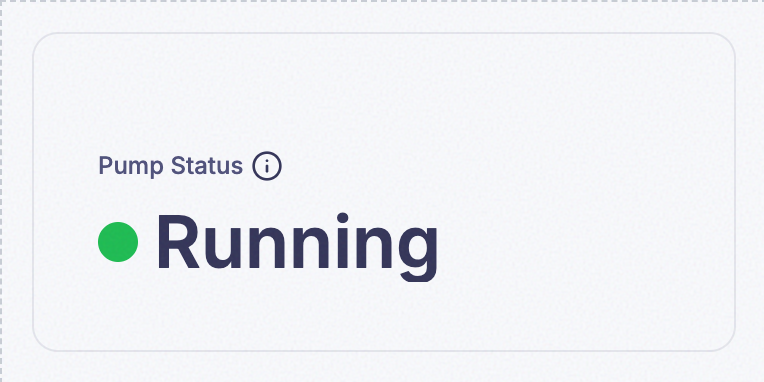
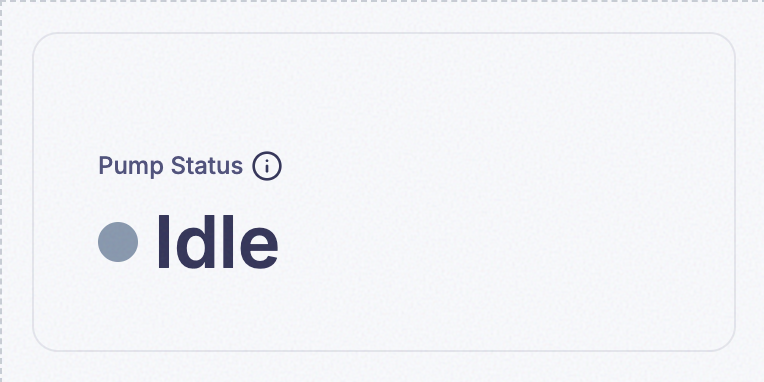
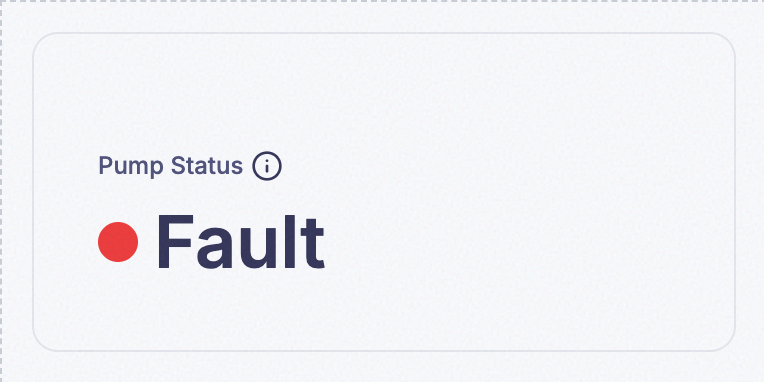
3. State Widget
Turns a numeric value into a color and a word, by checking which of a list of ranges the current value falls into. Where a Single Value widget makes someone read a number and judge it themselves, State does the judging for them — a glance at the color is enough, which is why it’s the natural choice for anything that’s really an operational status underneath a number, like a temperature that’s “fine” until it isn’t.
- Examples:
- A temperature status: “Cold” (blue) if below 18°C, “Normal” (green) if 18-24°C, “Hot” (red) if above 24°C.
- Machine status: “Idle” (grey), “Running” (green), “Warning” (yellow), “Error” (red).
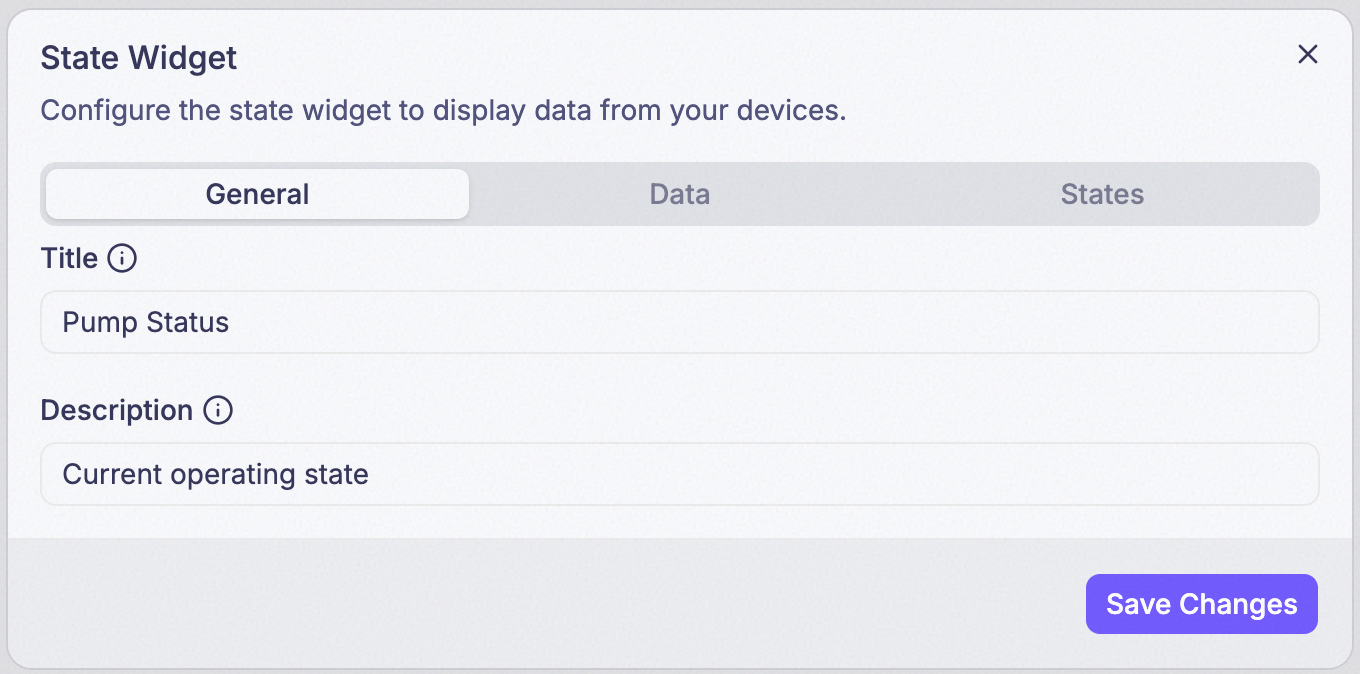
Step 1: Set Title and Description
Title is what’s actually displayed as the widget’s heading. Description isn’t shown on the card at all — it only appears in a tooltip when someone hovers the info icon (ⓘ) next to the title.
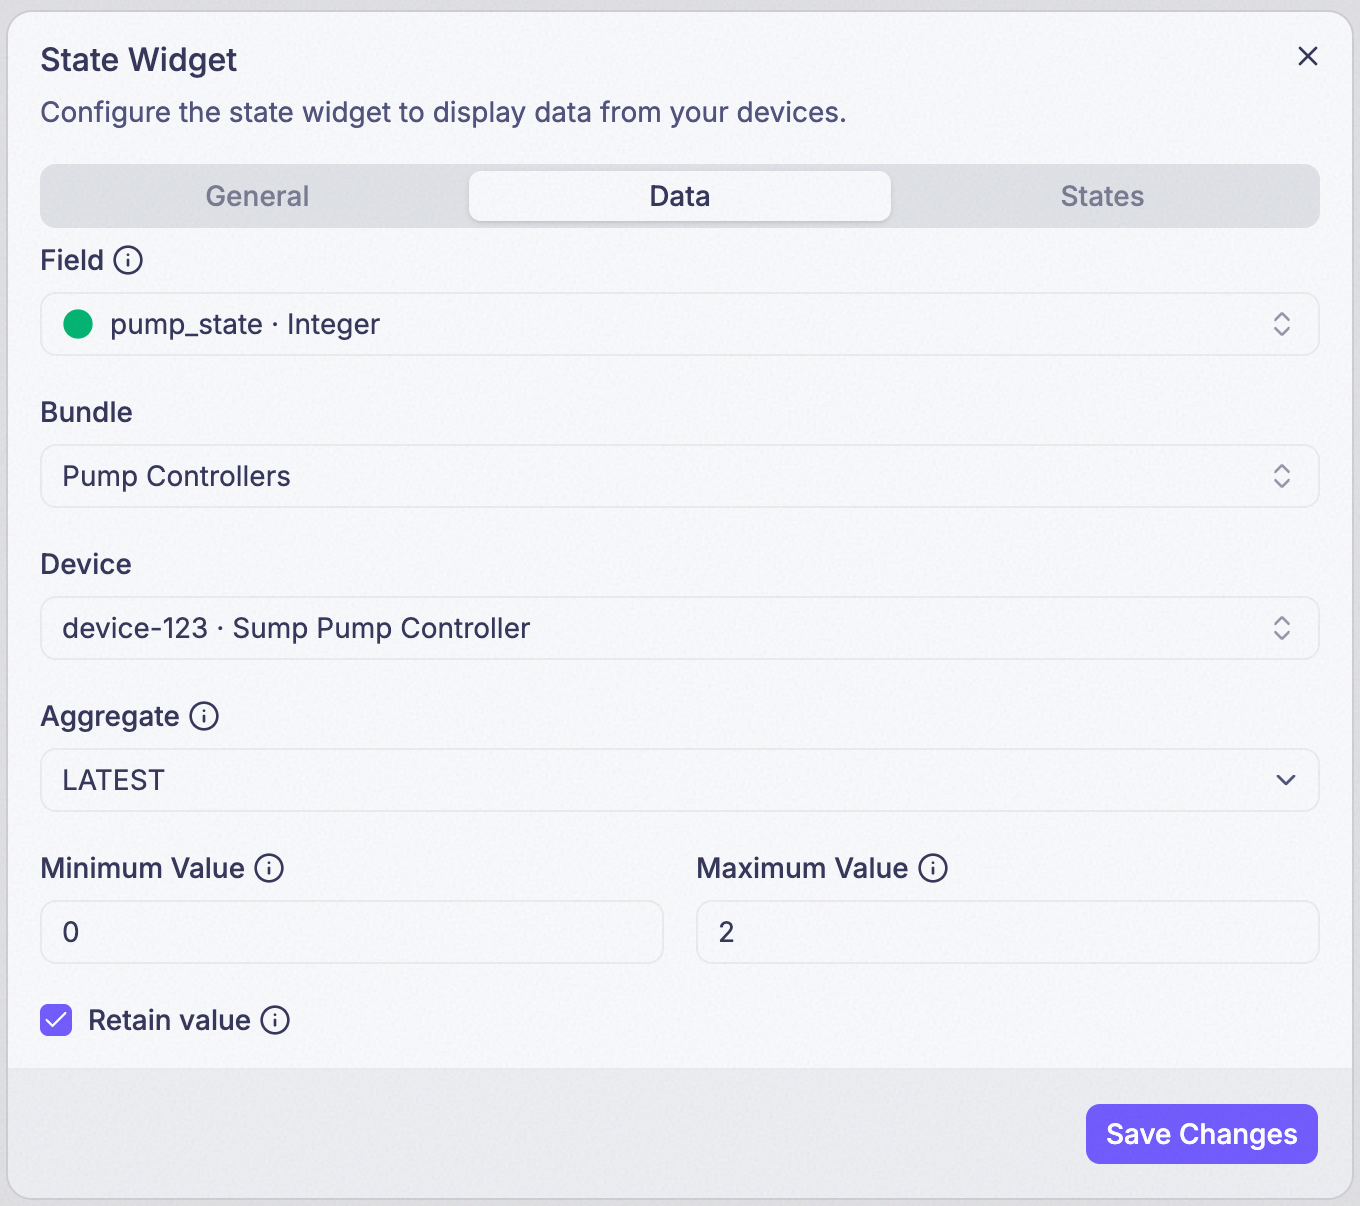
Step 2: Add the Field
Only numeric fields can be picked here.
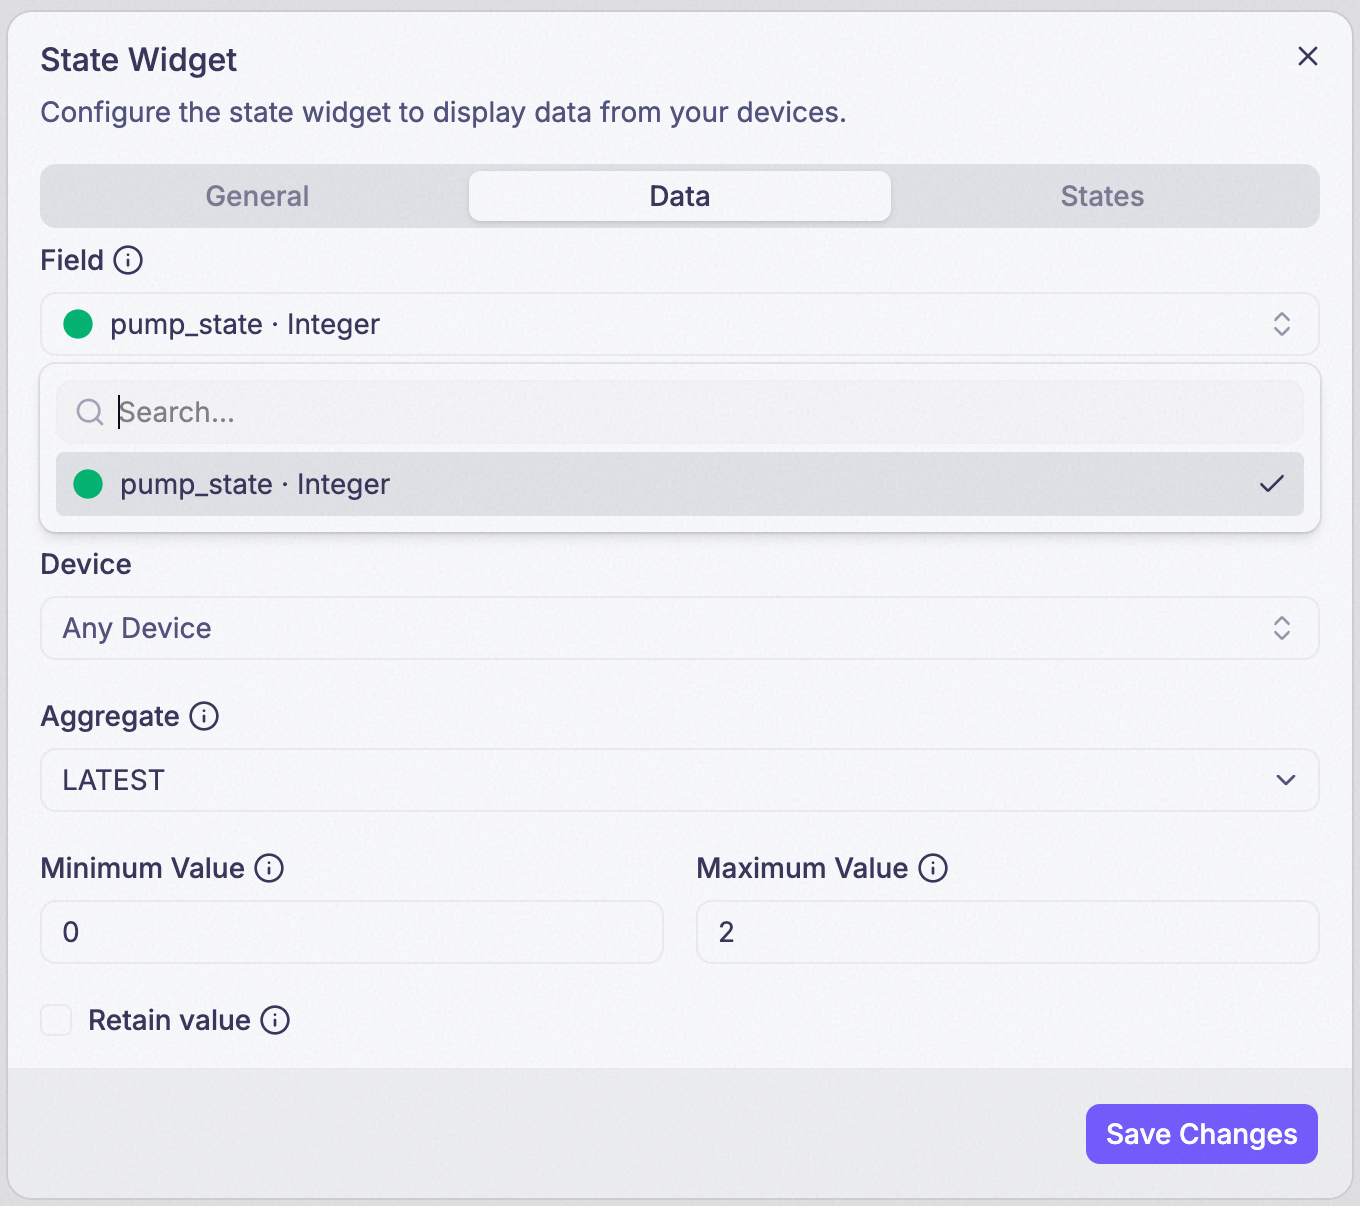
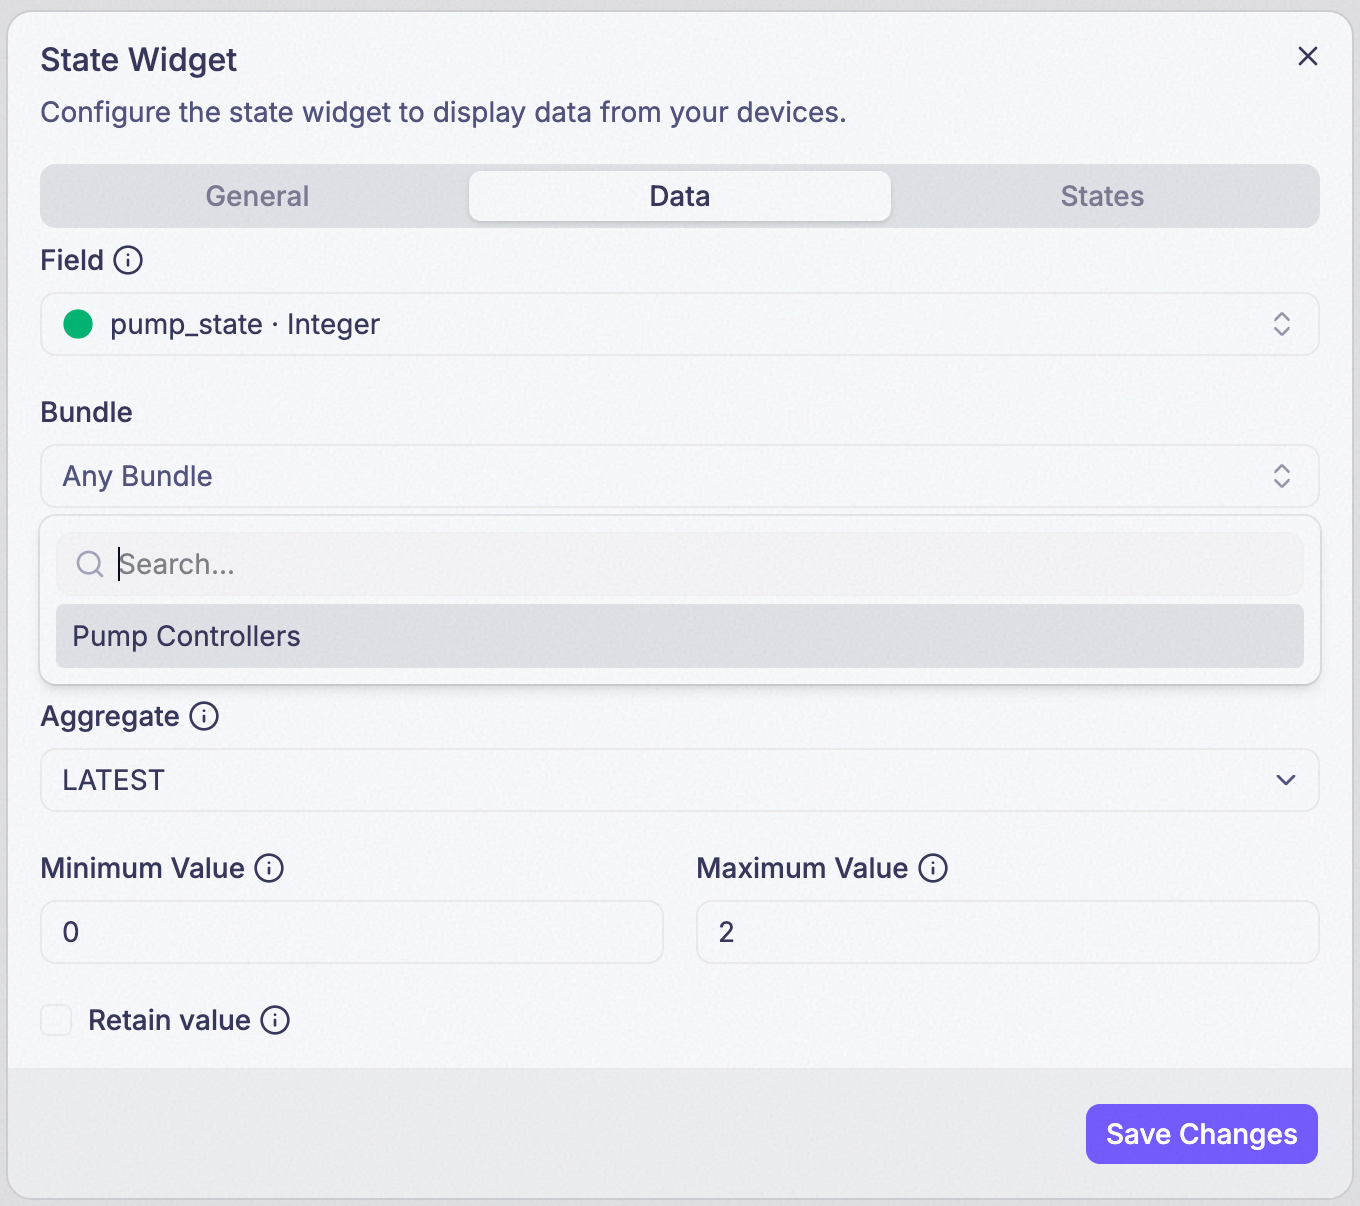
Step 3: Choose a Bundle (optional)
Points the widget at every device in a bundle instead of one device. Leave it blank to pick a single device instead, in the next step.
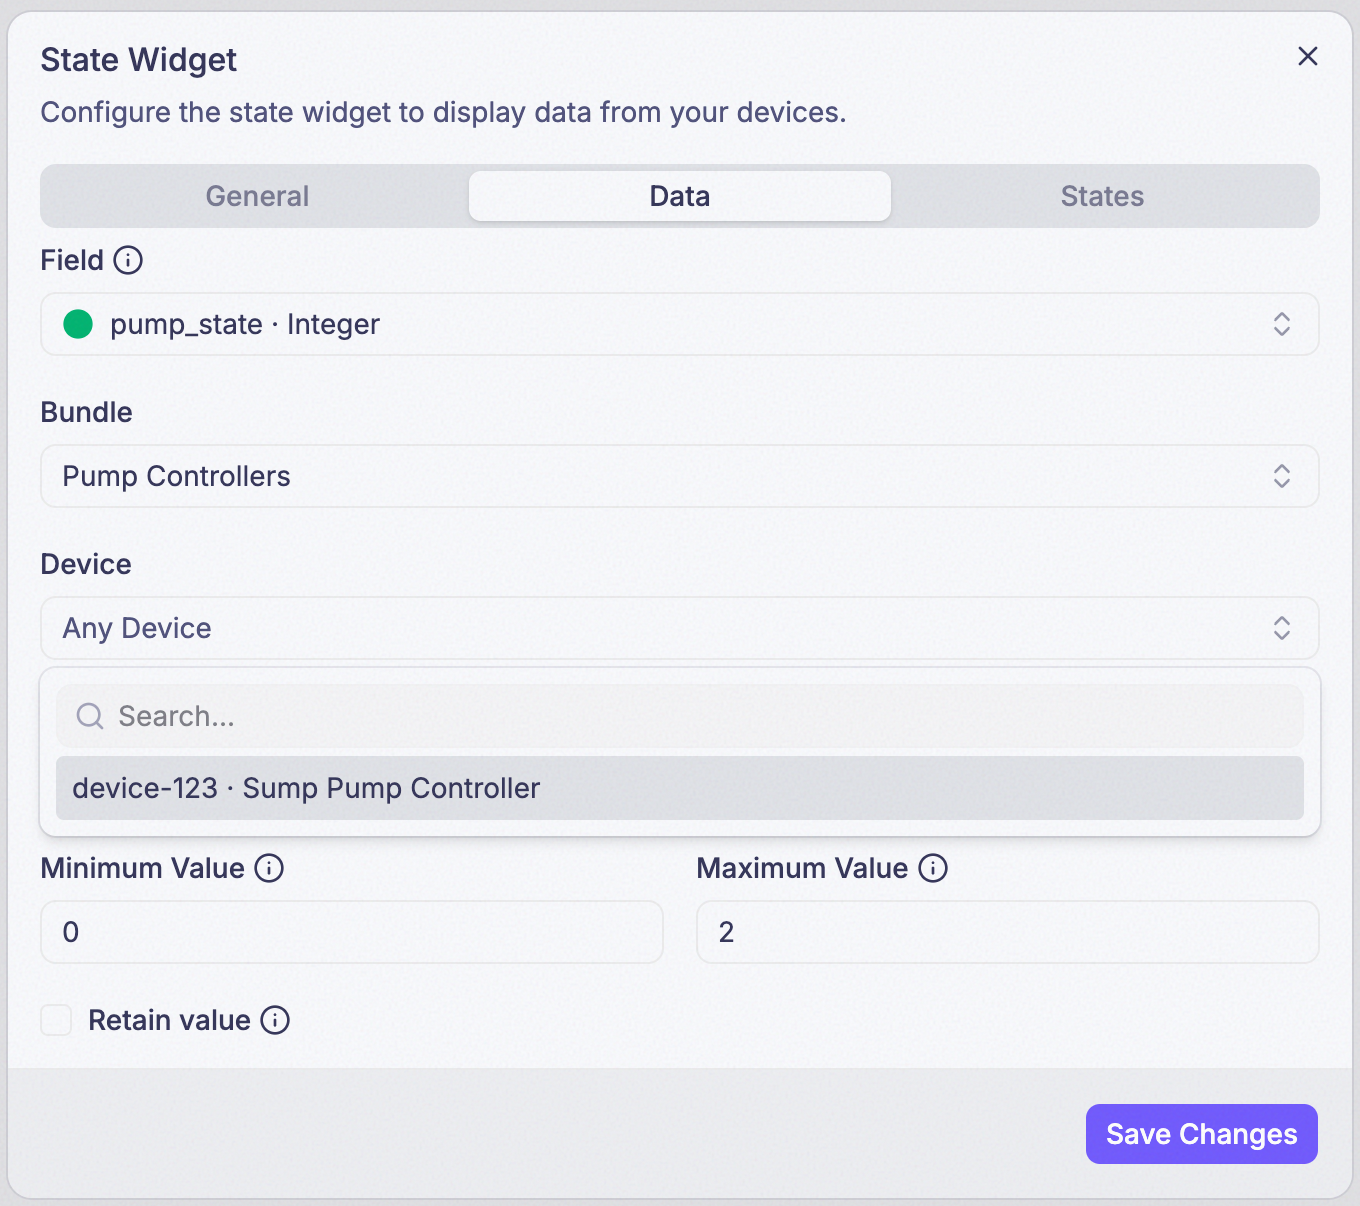
Step 4: Choose a Device (optional)
Points the widget at one specific device. Leave both Bundle and Device blank and the widget reads from any device that reports the field.
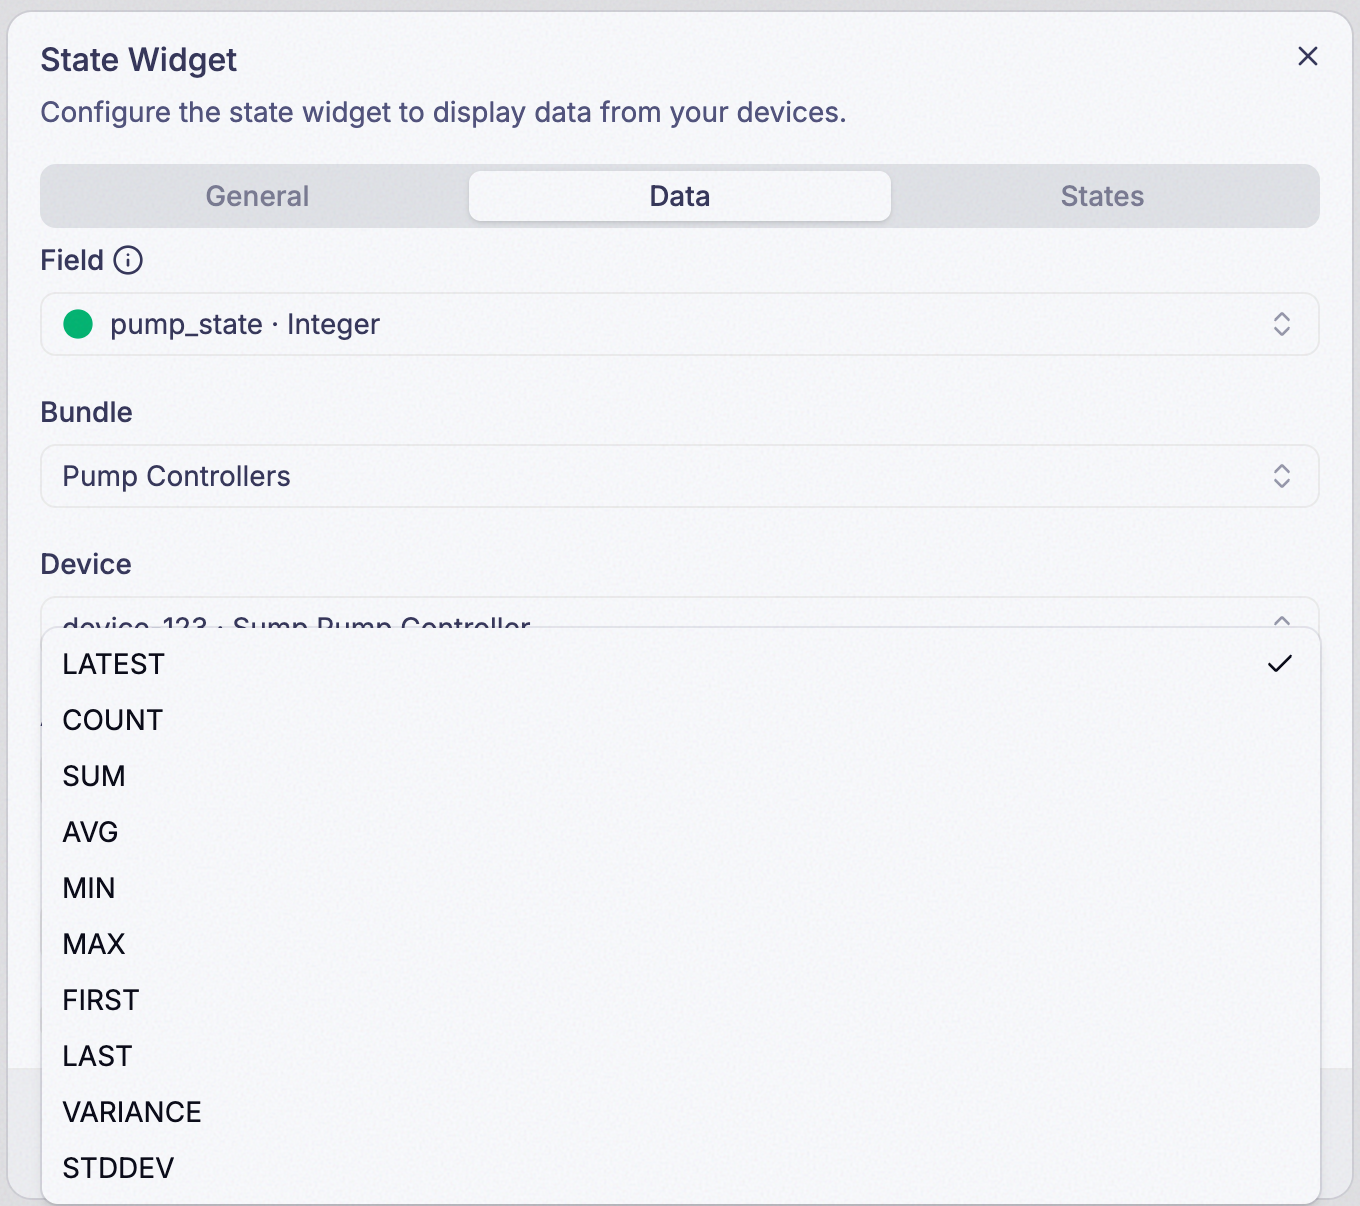
Step 5: Choose an Aggregate
Aggregate decides which single number is checked against your states:
| Mode | Shows |
|---|---|
LATEST | The most recent reading — ignores Time Range; see the callout below |
COUNT | How many readings arrived |
SUM | All readings added together |
AVG | The average of all readings |
MIN | The lowest reading |
MAX | The highest reading |
FIRST | The earliest reading inside the Time Range |
LAST | The most recent reading inside the Time Range |
VARIANCE | Statistical variance of the readings |
STDDEV | Standard deviation of the readings |
Picking anything other than LATEST reveals a Time Range field underneath it.
Step 6: Set Minimum Value, Maximum Value, and Retain
Minimum Value / Maximum Value are the overall expected range for your data field — Maximum must be
greater than Minimum. Retain only appears when Aggregate is LATEST; see the callout below for what
it does.
Step 7: Add each state
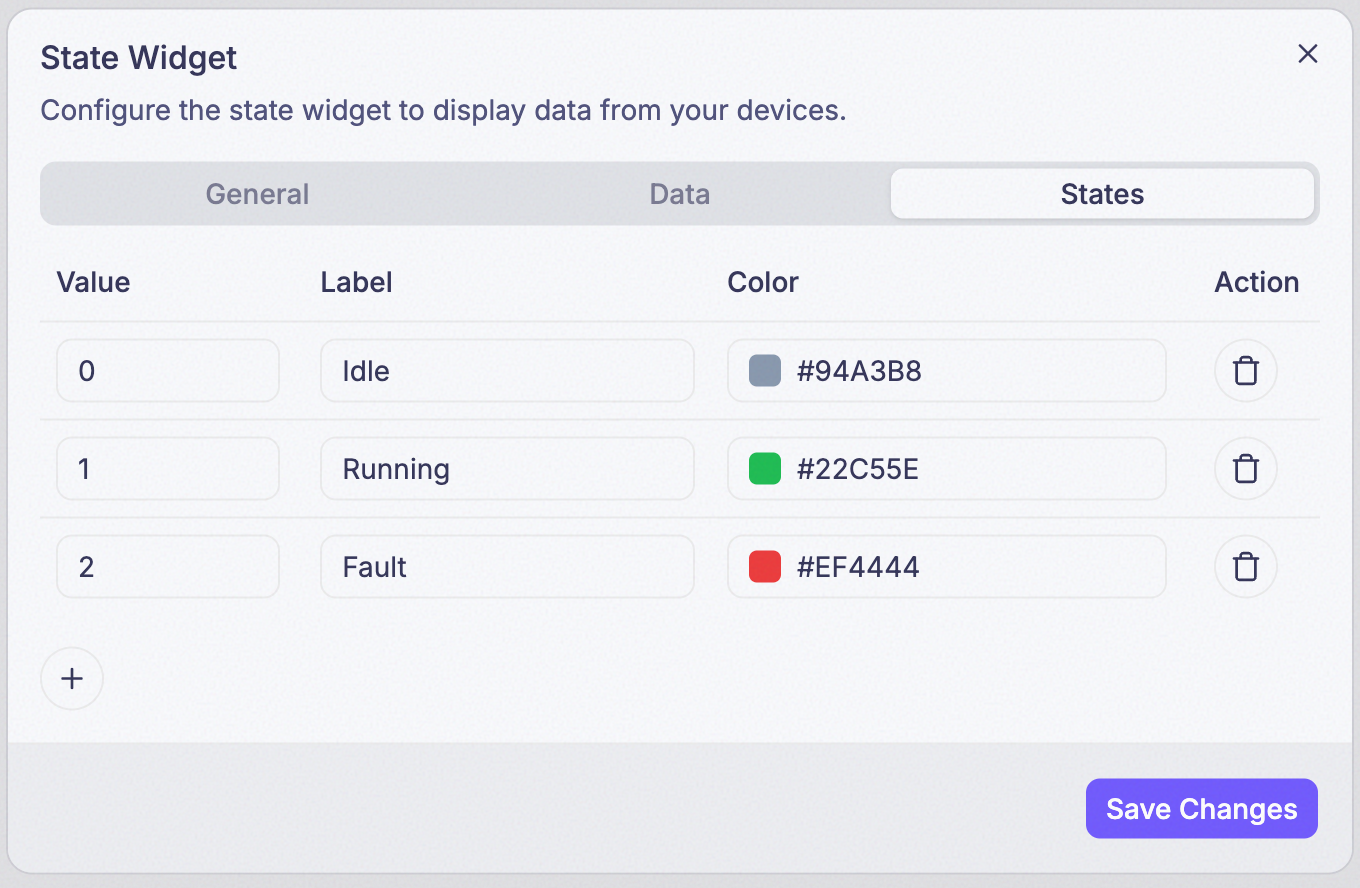
Every state gets a Value and a Label — the Label is the word someone actually reads (like “Idle” or “Running”), not the Value itself, which only exists to define where that word’s range starts. A reading falls into whichever state’s Value is the highest one at or below it, so each state takes over everything from its own Value up to (but not including) the next one:
| Value | Label |
|---|---|
0 | Idle |
1 | Running |
2 | Fault |
With this table, a reading of 1 lands in Running (past 0, not yet 2).
Step 8: Set each state’s Color
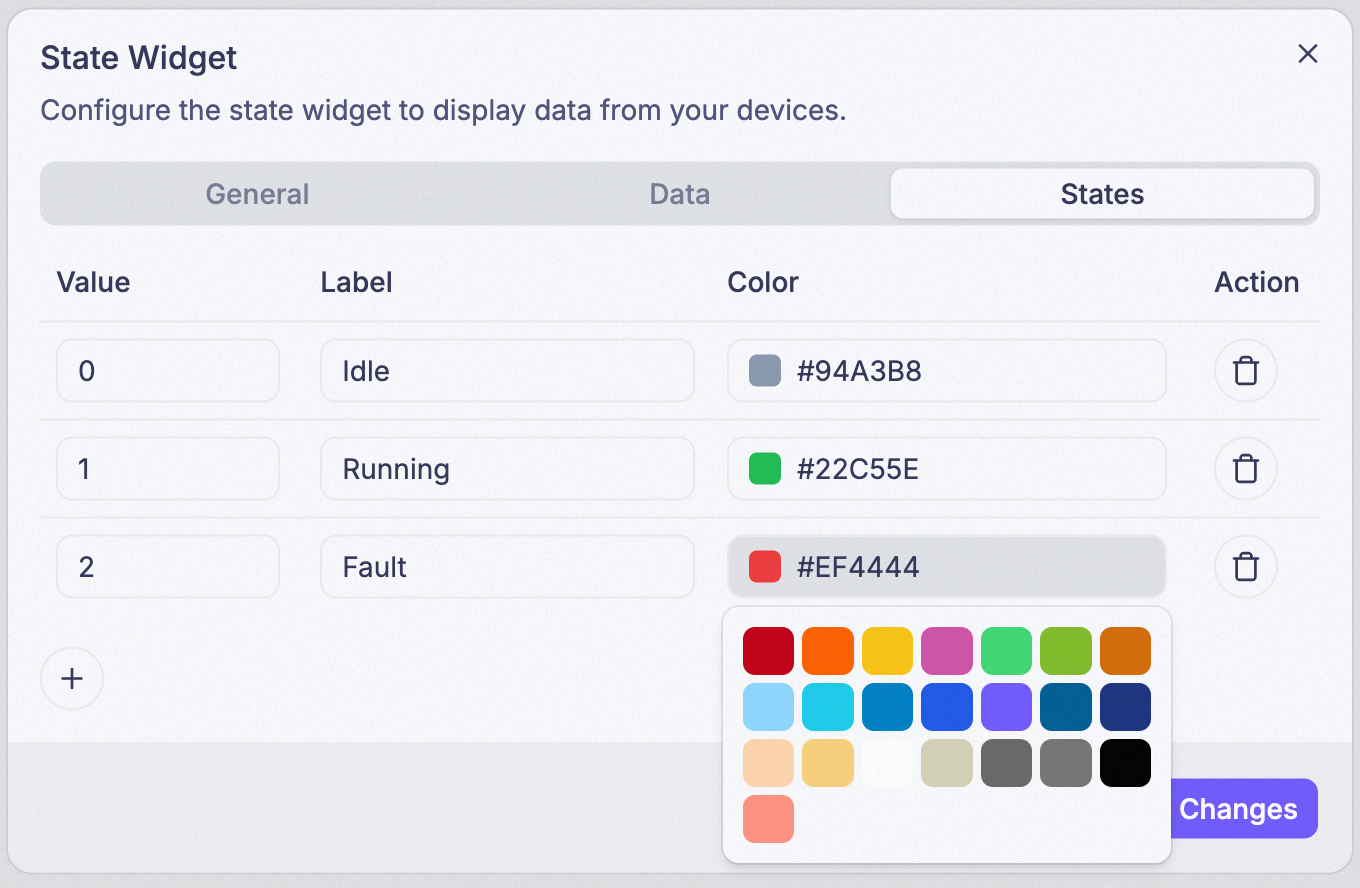
Two rules are enforced, not just recommended: every state’s Value must be unique, and the lowest state’s Value must exactly equal your Minimum Value — the widget won’t save otherwise.
LATEST and LAST sound like the same thing and aren’t. LAST respects
whatever Time Range you set; LATEST ignores Time Range entirely and
looks back 15 minutes on its own (30 days with Retain on). See the
full explanation on the Single Value
Widget page.
Example
The same Idle / Running / Fault setup from Step 7, showing a reading in each state: