2. Graph Widget
Plots one or more device fields as lines, bars, or a filled area over time, so you can see a trend rather than a single point. Where the Single Value widget answers “what is it now,” the Graph widget answers “what has it been doing.” Reach for it when a single number would hide the story — a spike that came and went, a slow drift upward, or two readings that only make sense compared side by side. If the question is closer to “how often” than “when,” a Histogram usually answers it more directly than a Graph would.
- Examples:
- A chart showing temperature and humidity trends over the last day.
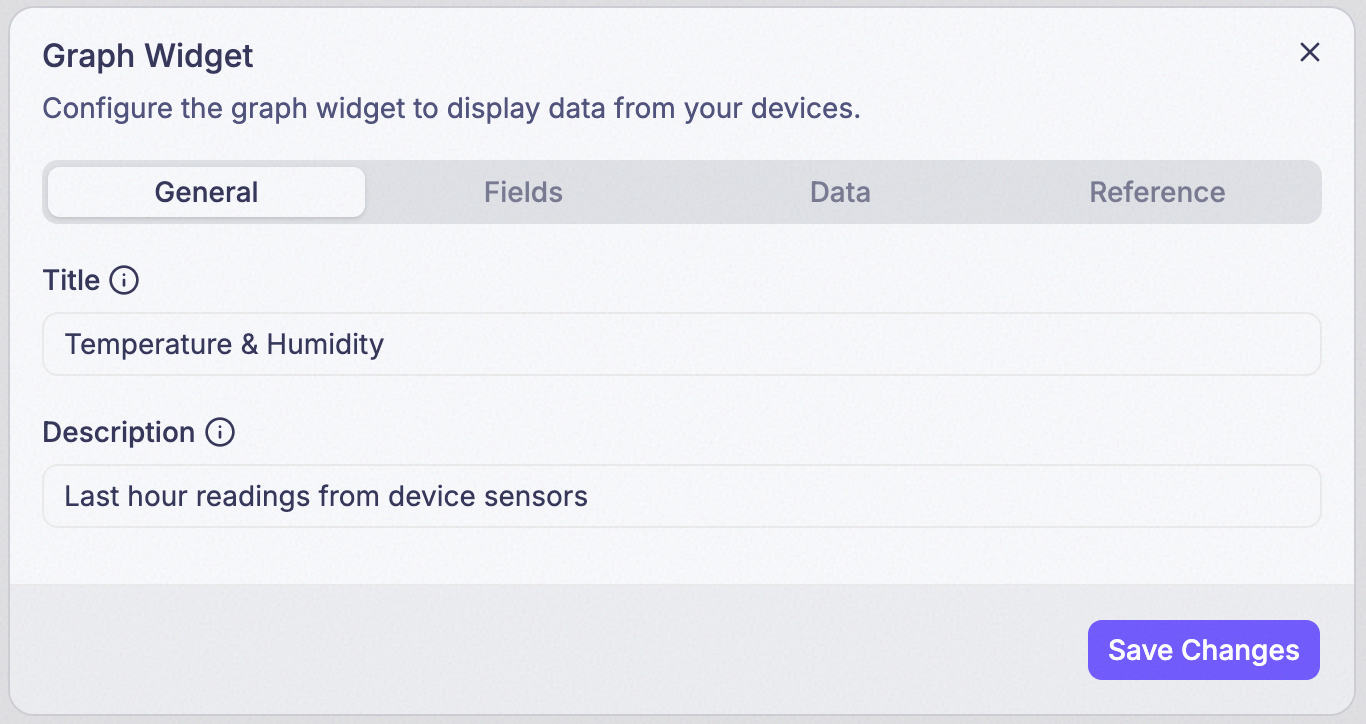
Step 1: Set Title and Description
Title is what’s actually displayed as the widget’s heading. Description isn’t shown on the card at all — it only appears in a tooltip when someone hovers the info icon (ⓘ) next to the title.
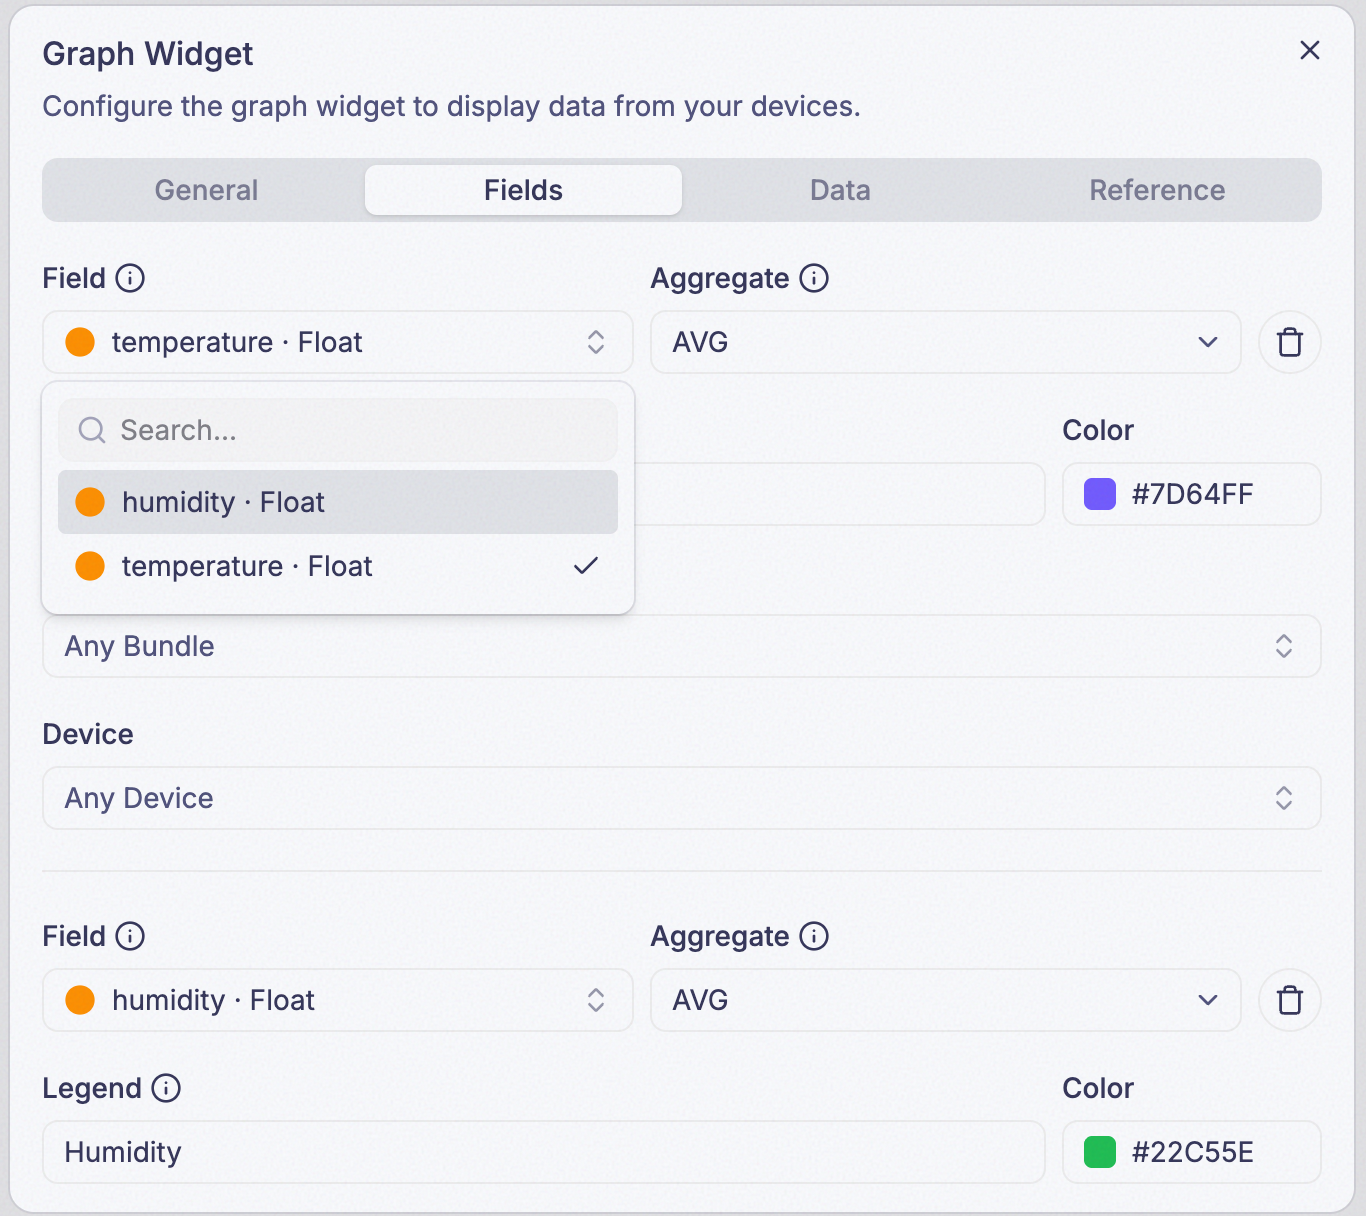
Step 2: Add a Field
Only numeric fields can be picked here. The sensor reading for this series (e.g., internal_temp_celsius,
external_temp_celsius).
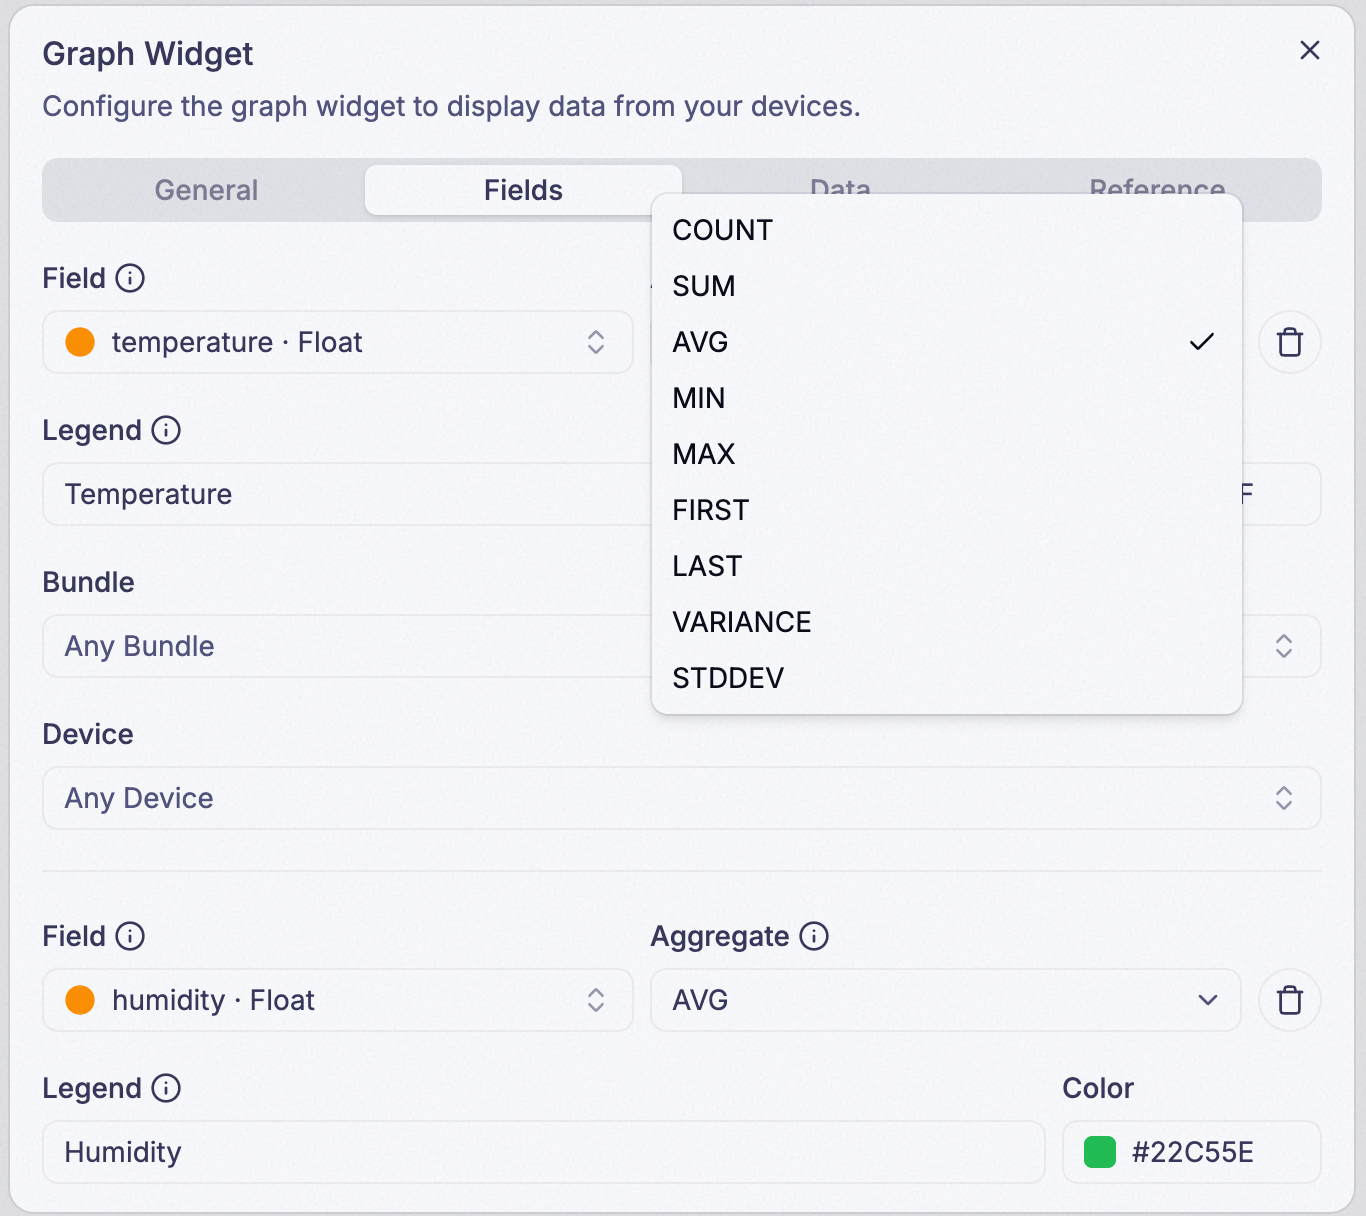
Step 3: Choose an Aggregate for the field
Aggregate decides which single number represents this field inside each bucket:
| Mode | Shows |
|---|---|
COUNT | How many readings arrived |
SUM | All readings added together |
AVG | The average of all readings |
MIN | The lowest reading |
MAX | The highest reading |
FIRST | The earliest reading inside the bucket |
LAST | The most recent reading inside the bucket |
VARIANCE | Statistical variance of the readings |
STDDEV | Standard deviation of the readings |
No LATEST here — a chart needs a value for every bucket, not just the most recent one, so LATEST
isn’t offered.
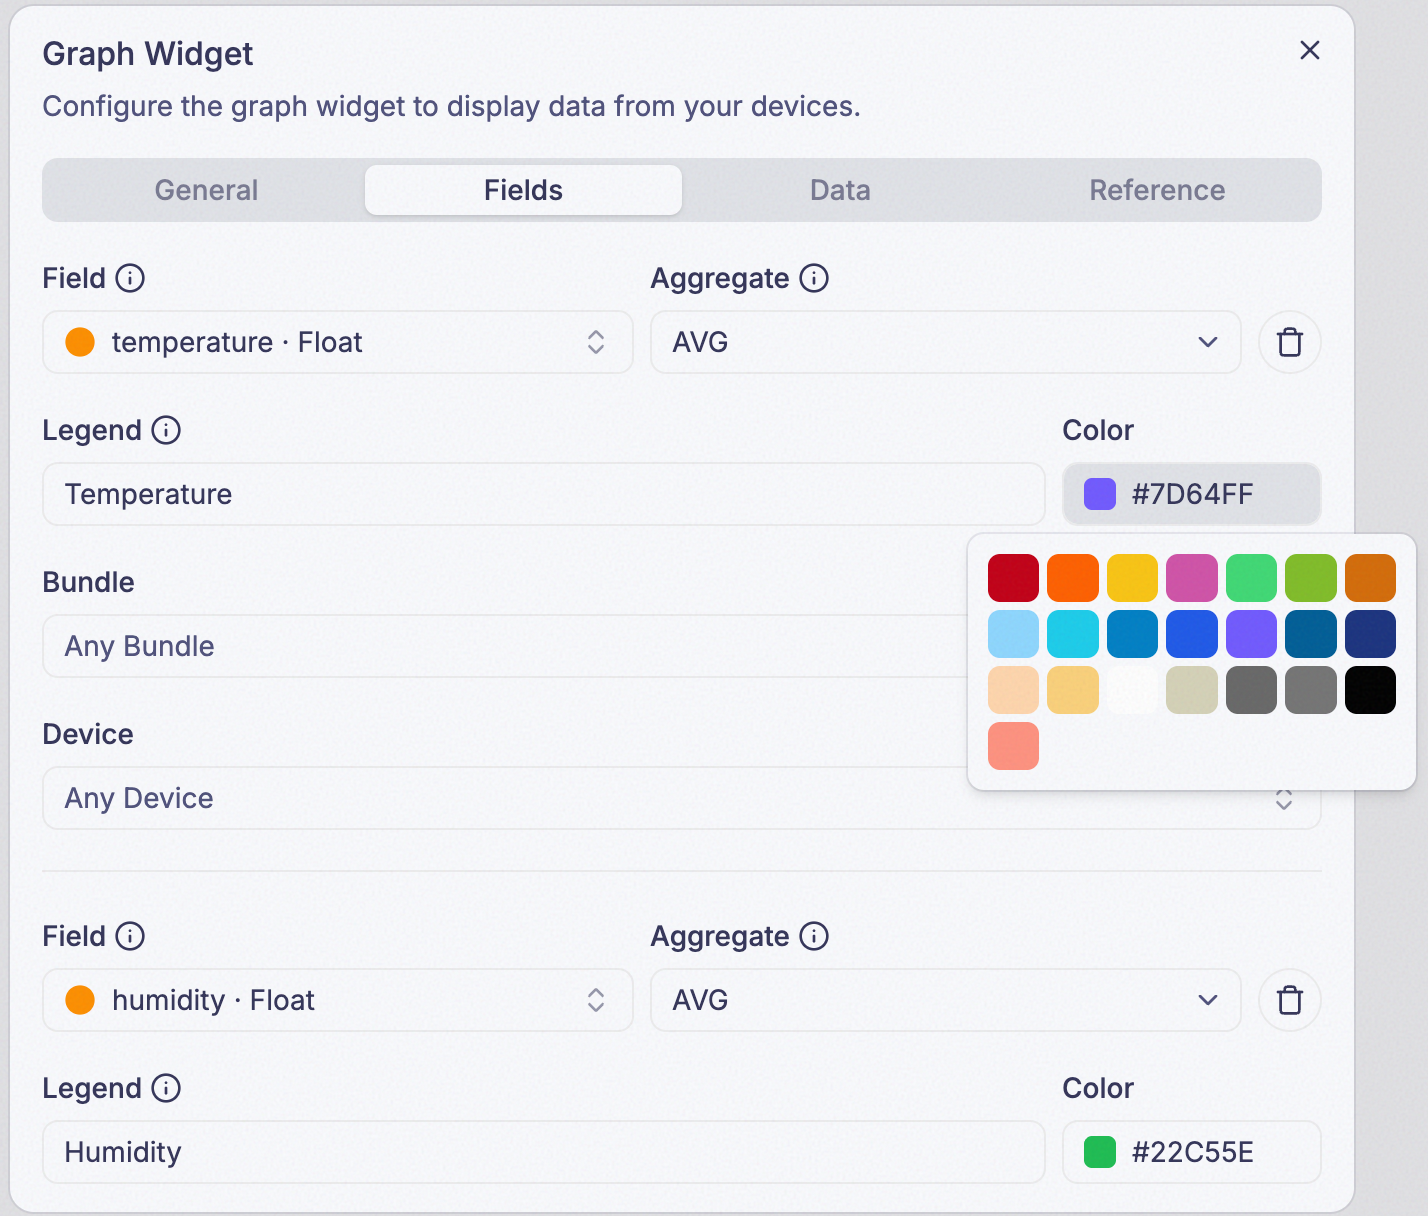
Step 4: Set Legend and Color
Legend is how this series is named in the chart’s legend. Color is its color on the chart.
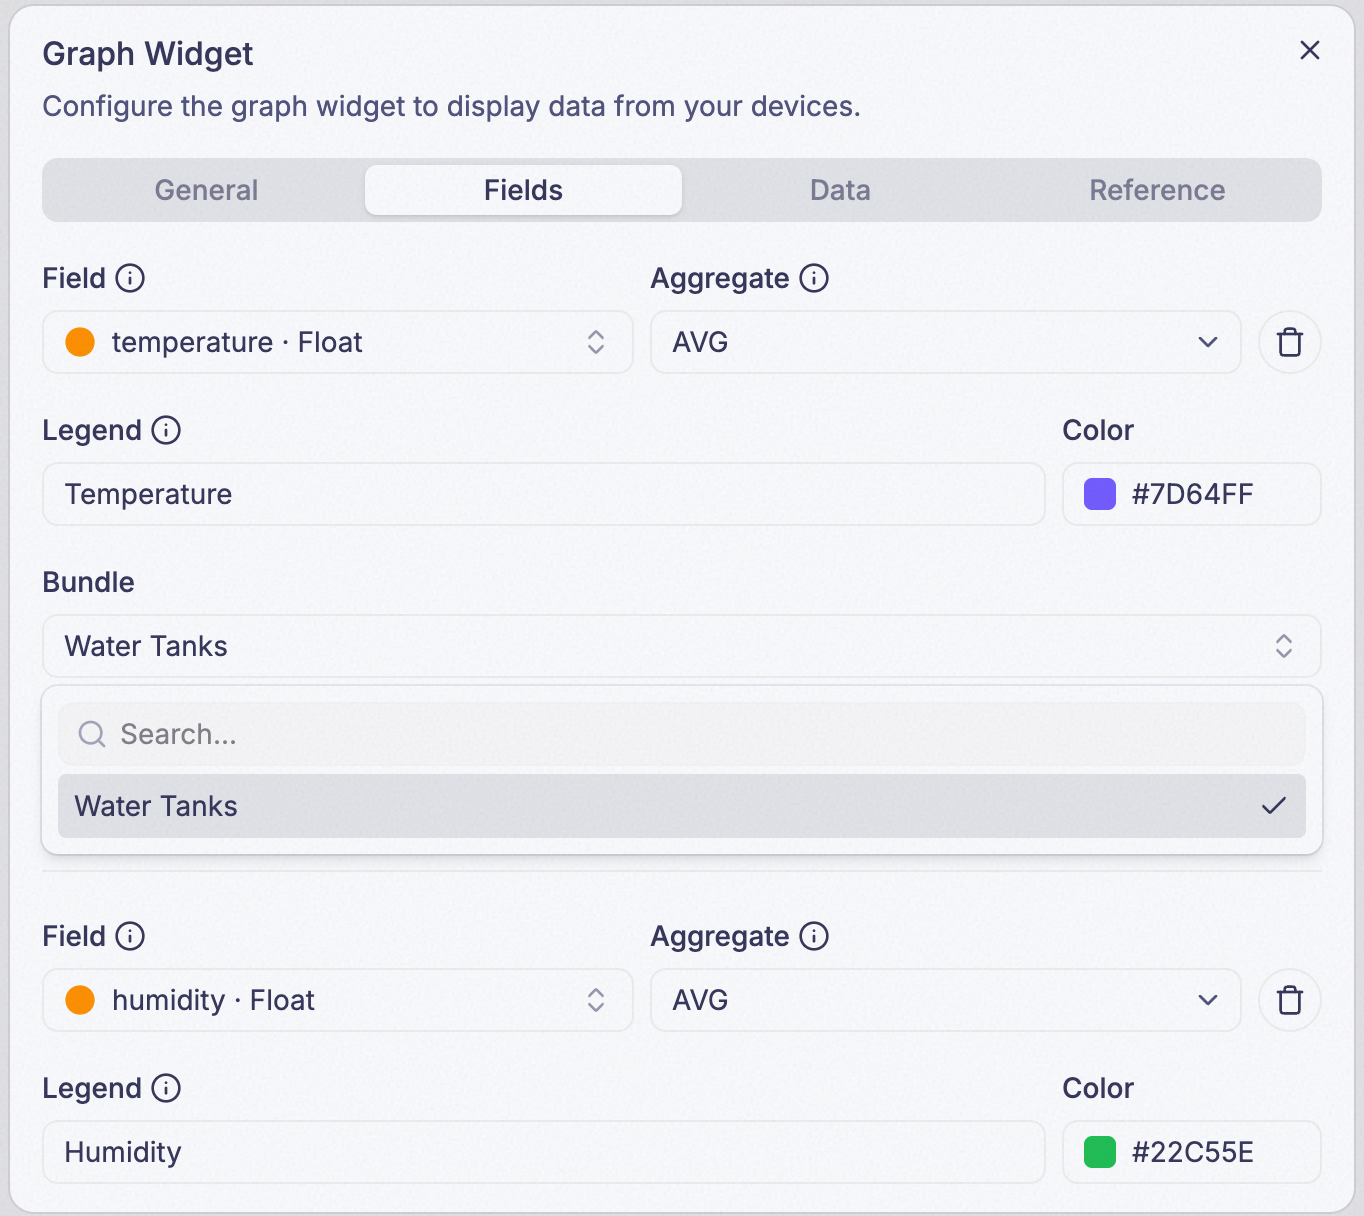
Step 5: Choose a Bundle (optional)
Points this series at every device in a bundle instead of one device. Leave it blank to pick a single device instead, in the next step.
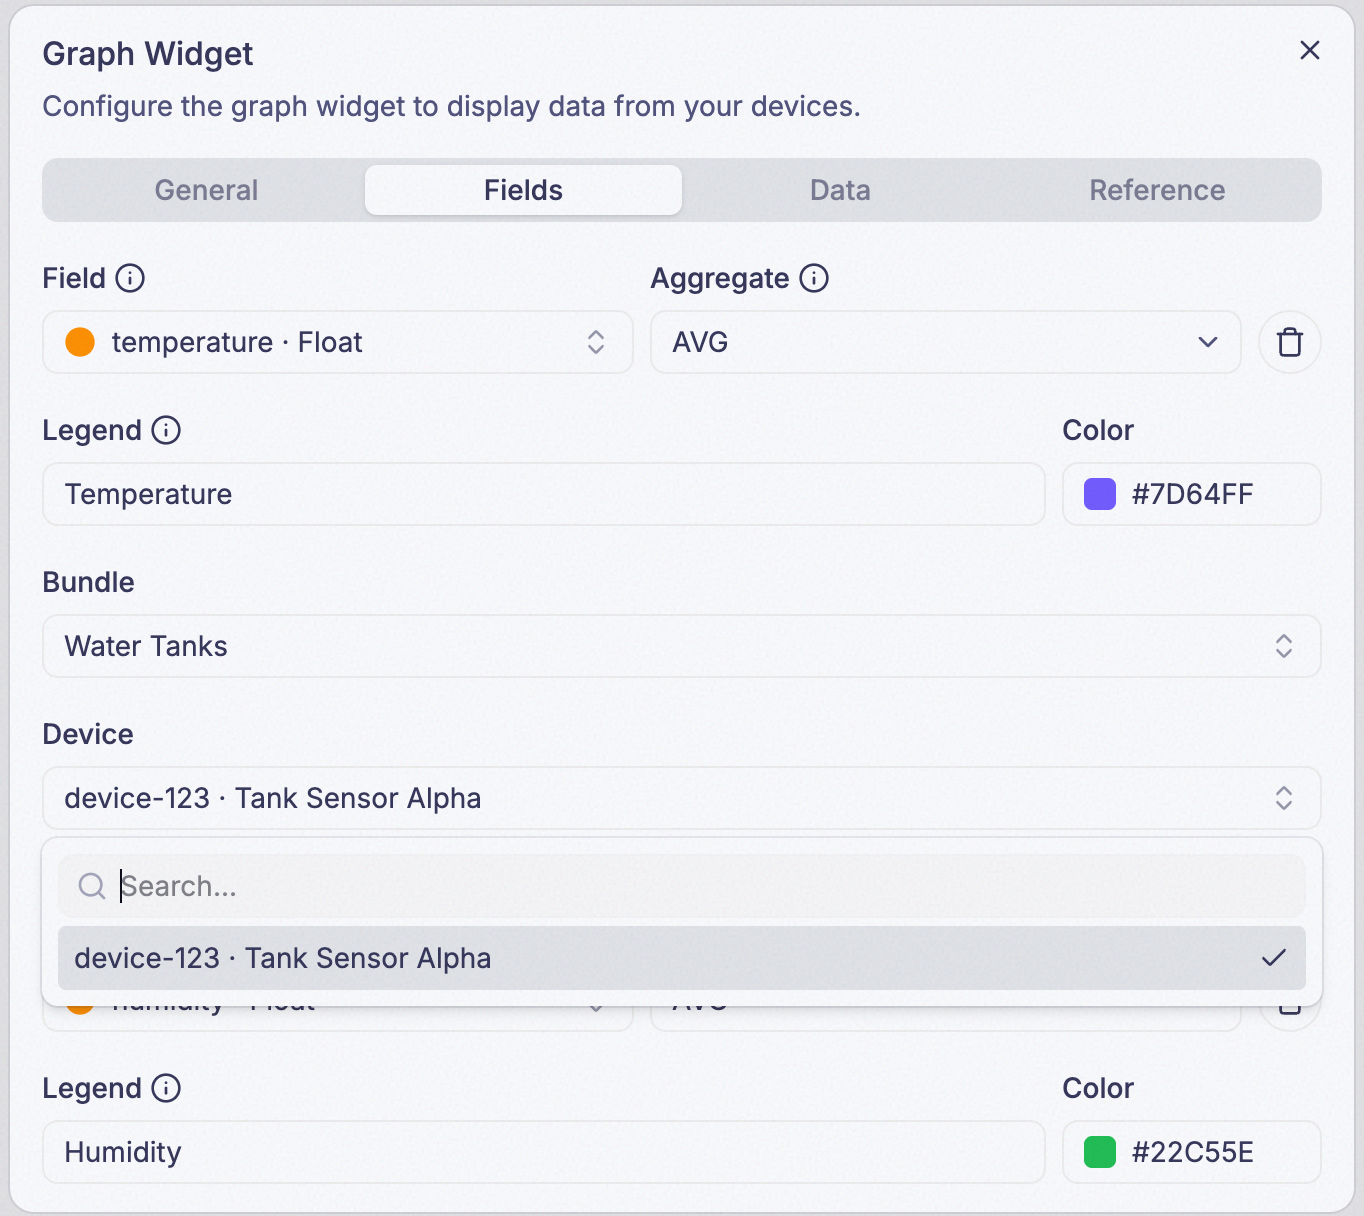
Step 6: Choose a Device (optional)
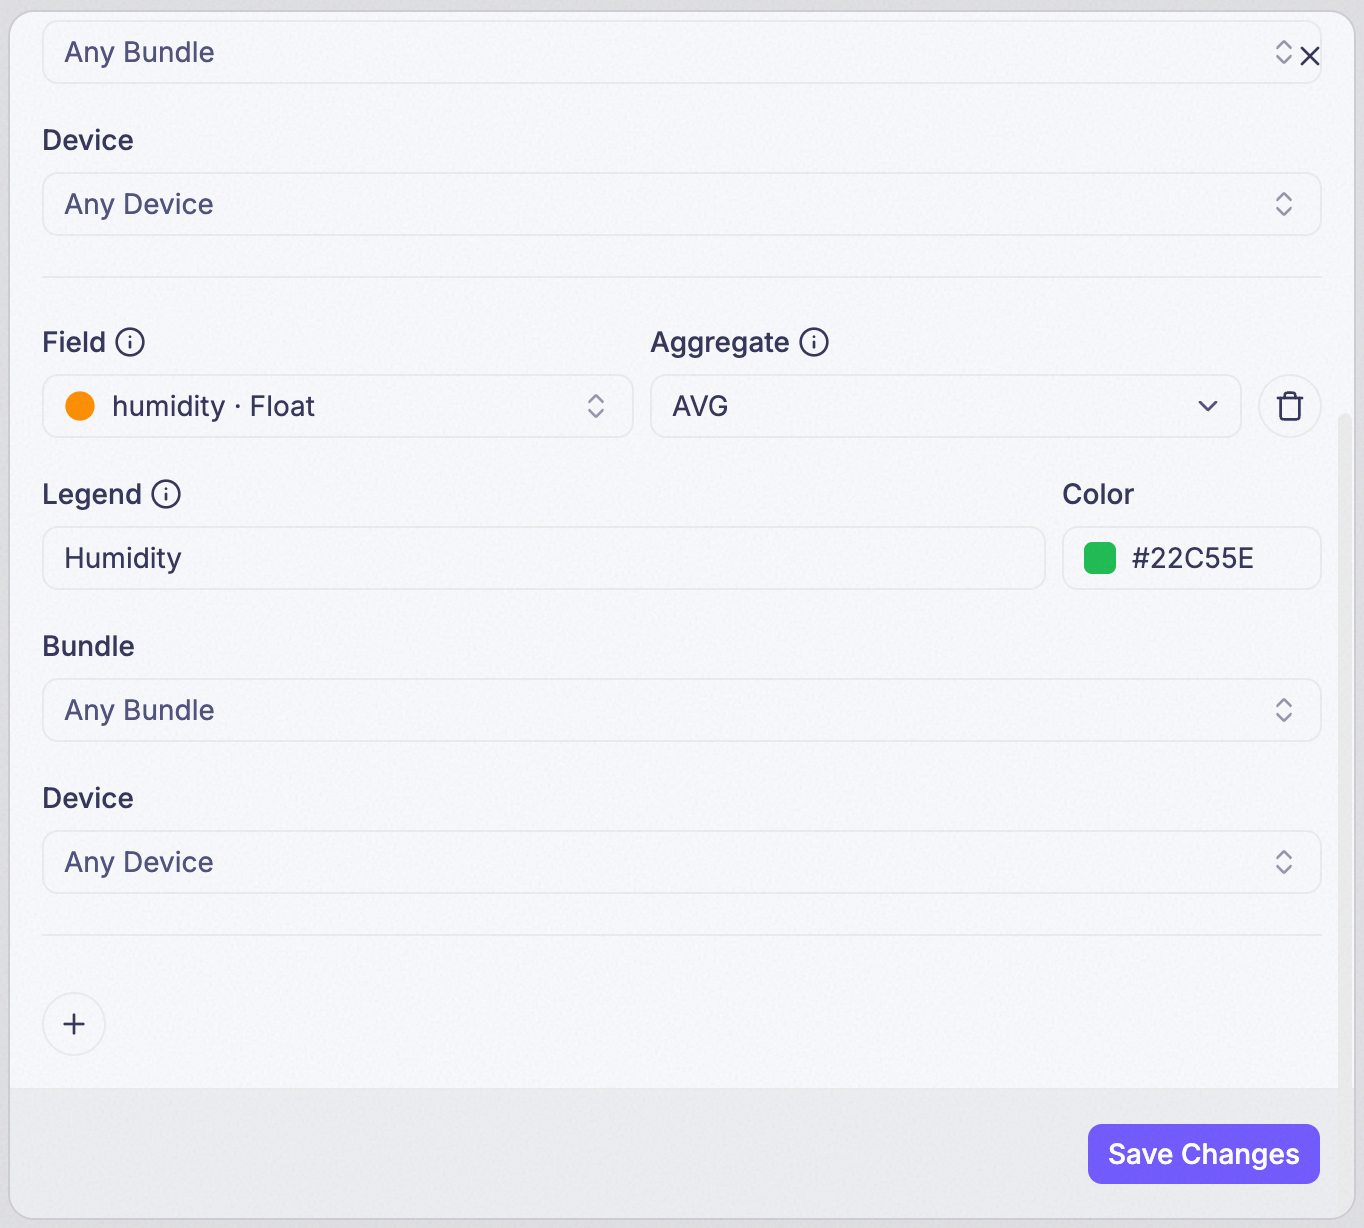
Points this series at one specific device. Leave both Bundle and Device blank and it reads from any device that reports the field.
Step 7: Add another field (optional)
A Graph can plot more than one series at once. Add a second field and repeat Steps 2–6 for it — it gets its own Field, Aggregate, Legend, Color, Bundle, and Device. This is what turns a single-line chart into a comparison: two different fields on the same device, the same field across two devices, or the same field summarised two different ways.
Step 8: Set Interval
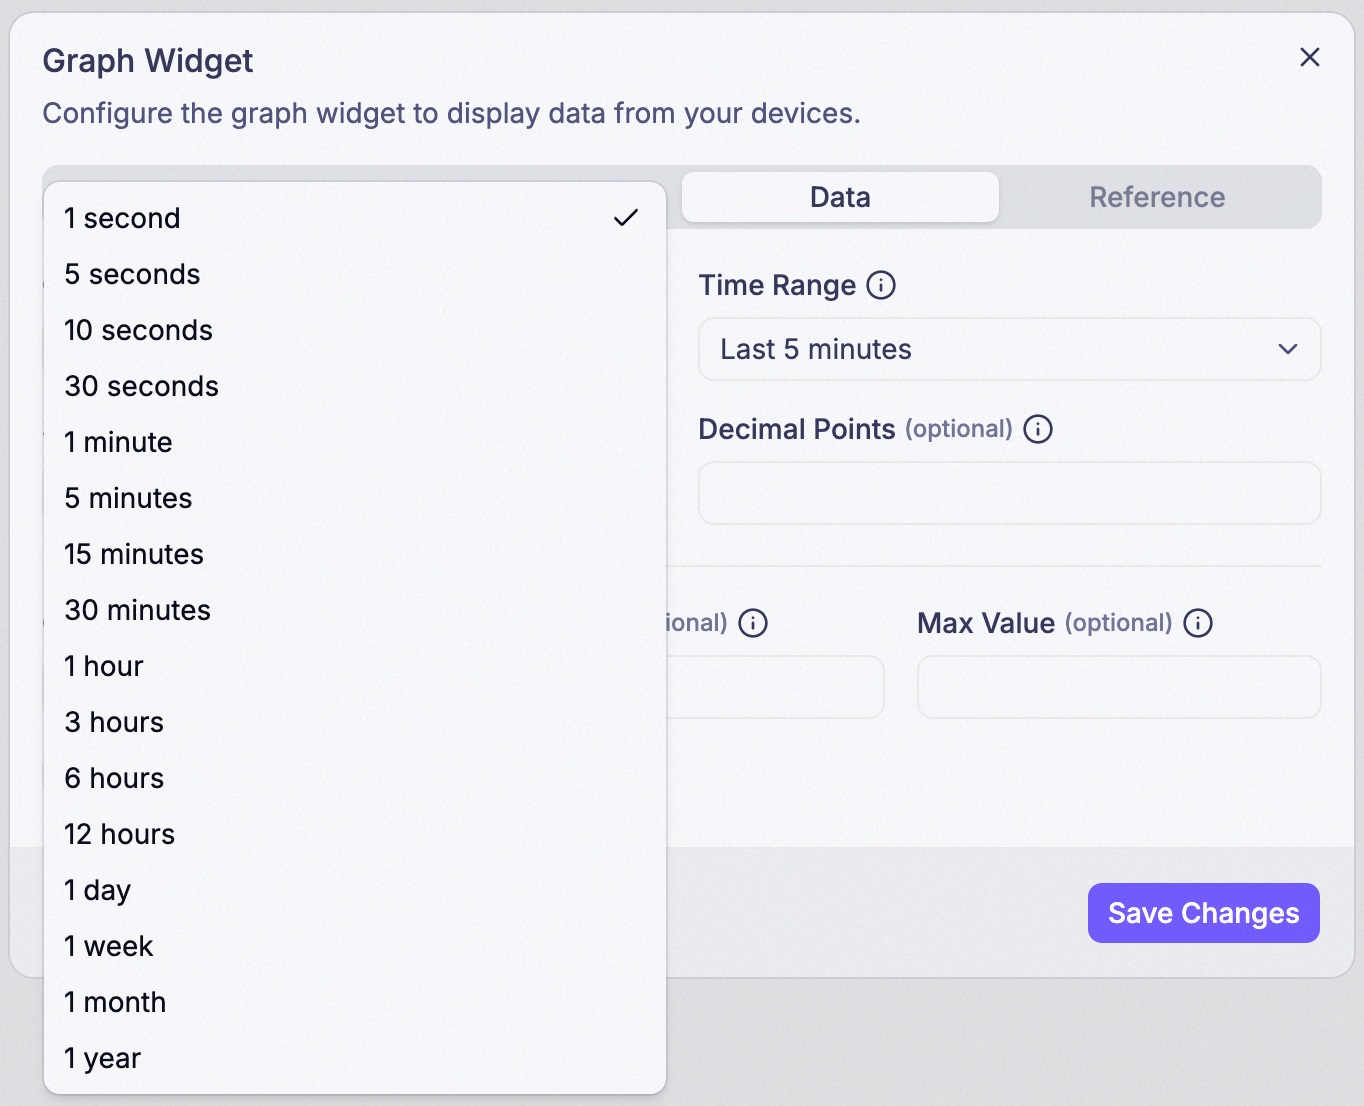
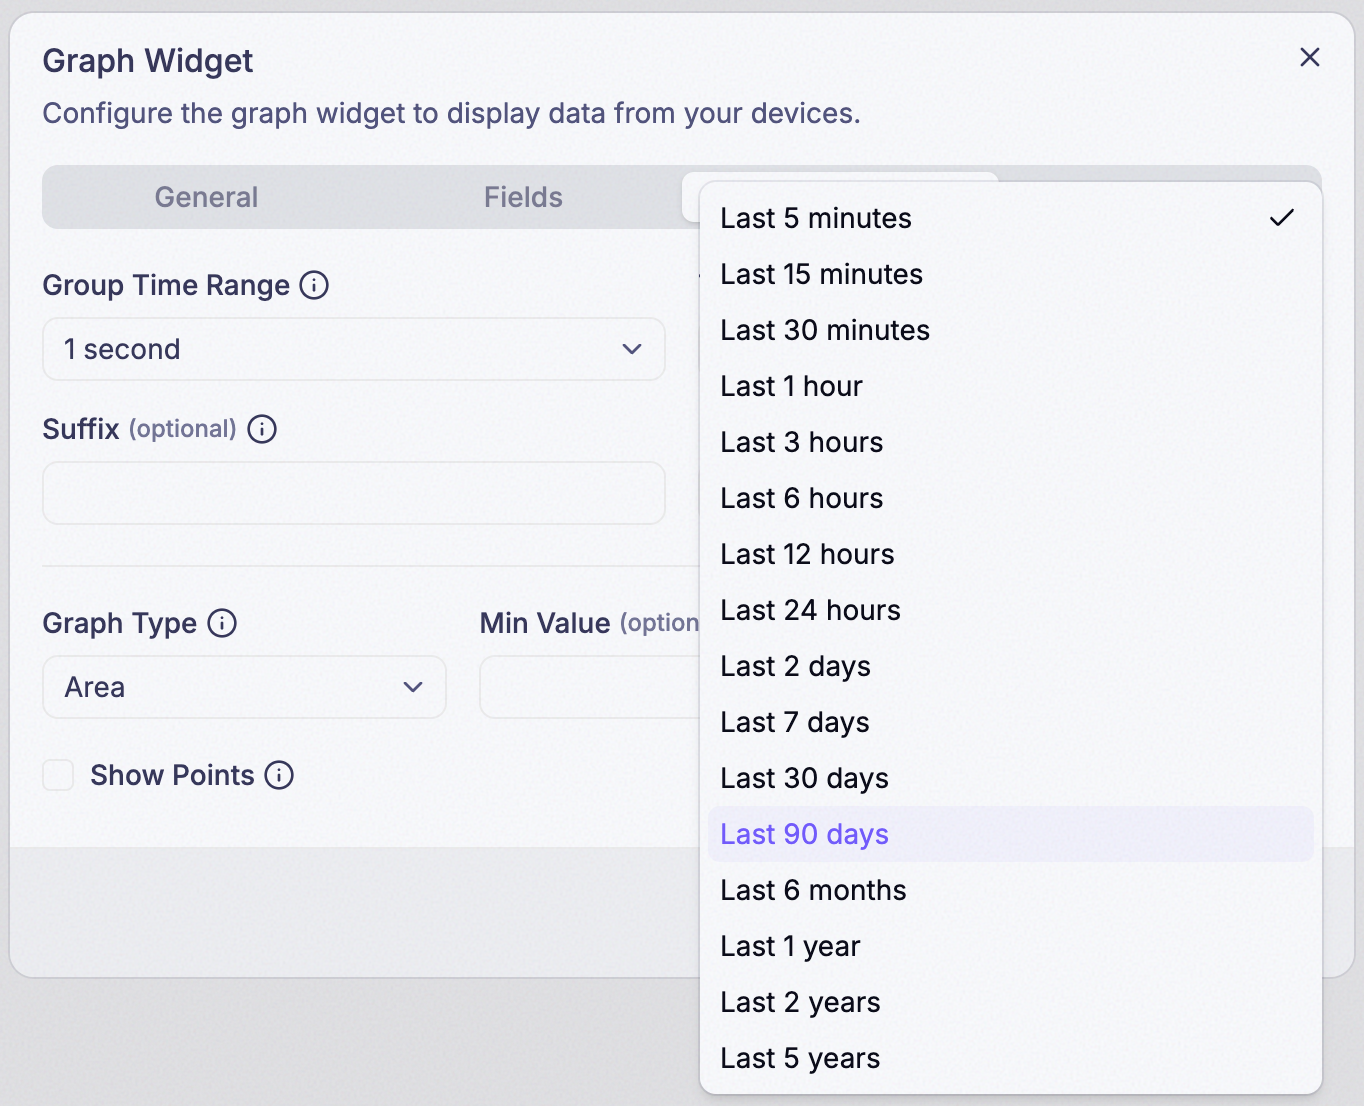
Slices the Time Range into individual data points — a 1-minute Interval over a 1-hour Time Range draws 60 points, a 1-hour one over the same range draws 1.
Step 9: Set Time Range
The overall period the chart covers.
Step 10: Set Suffix and Decimal Points
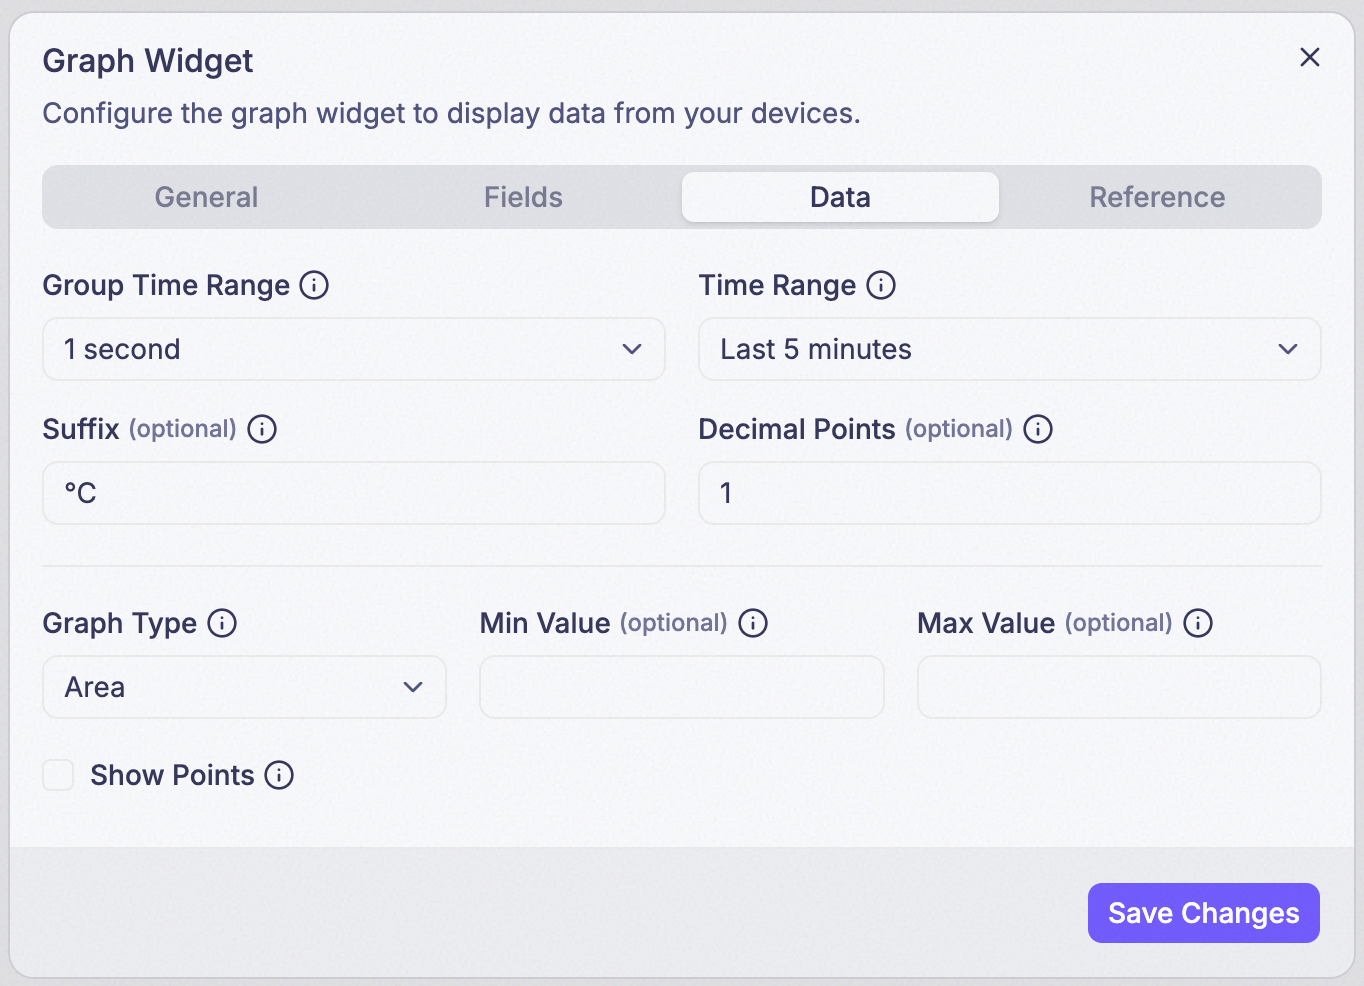
Suffix is an optional general unit for the Y-axis (e.g., “°C”). Decimal Points is optional too.
Step 11: Set Graph Type
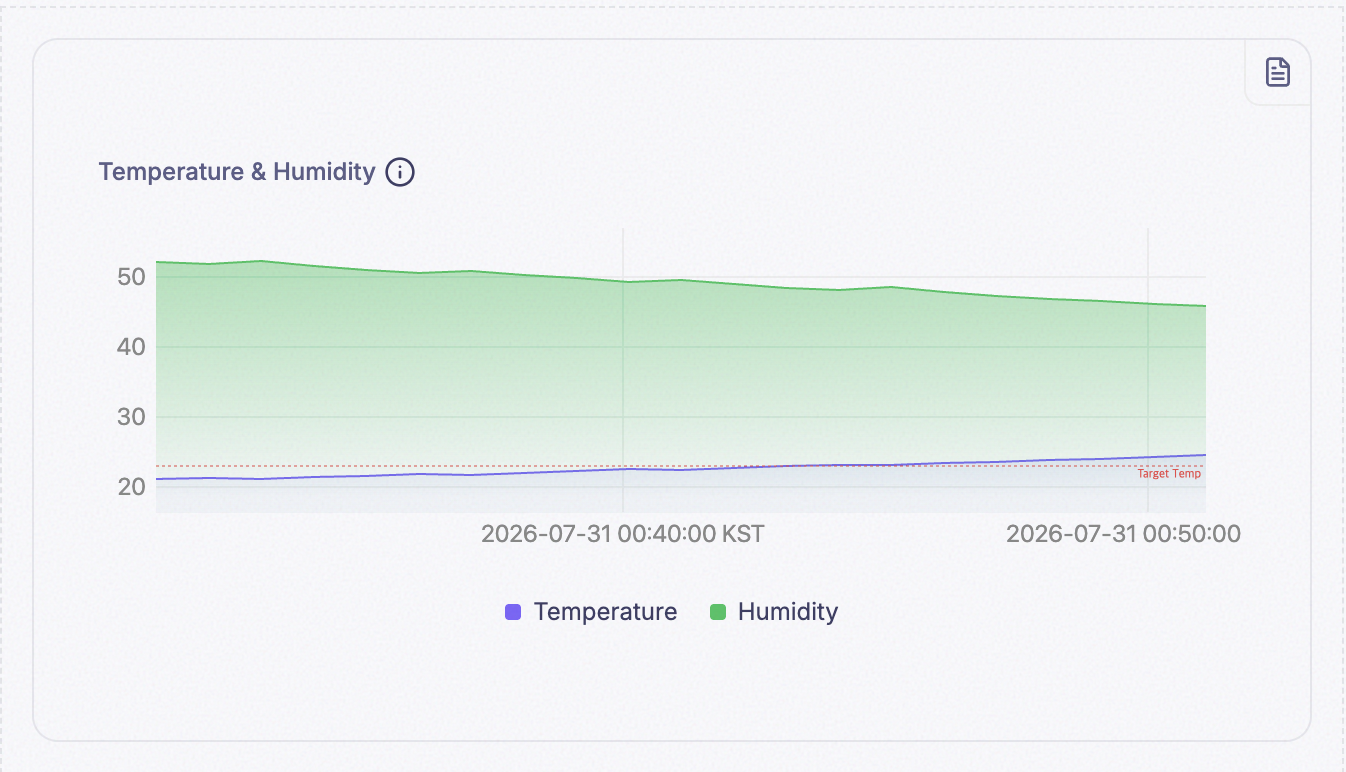
Area fills the space under the line, which reads well for a single series or for showing volume.
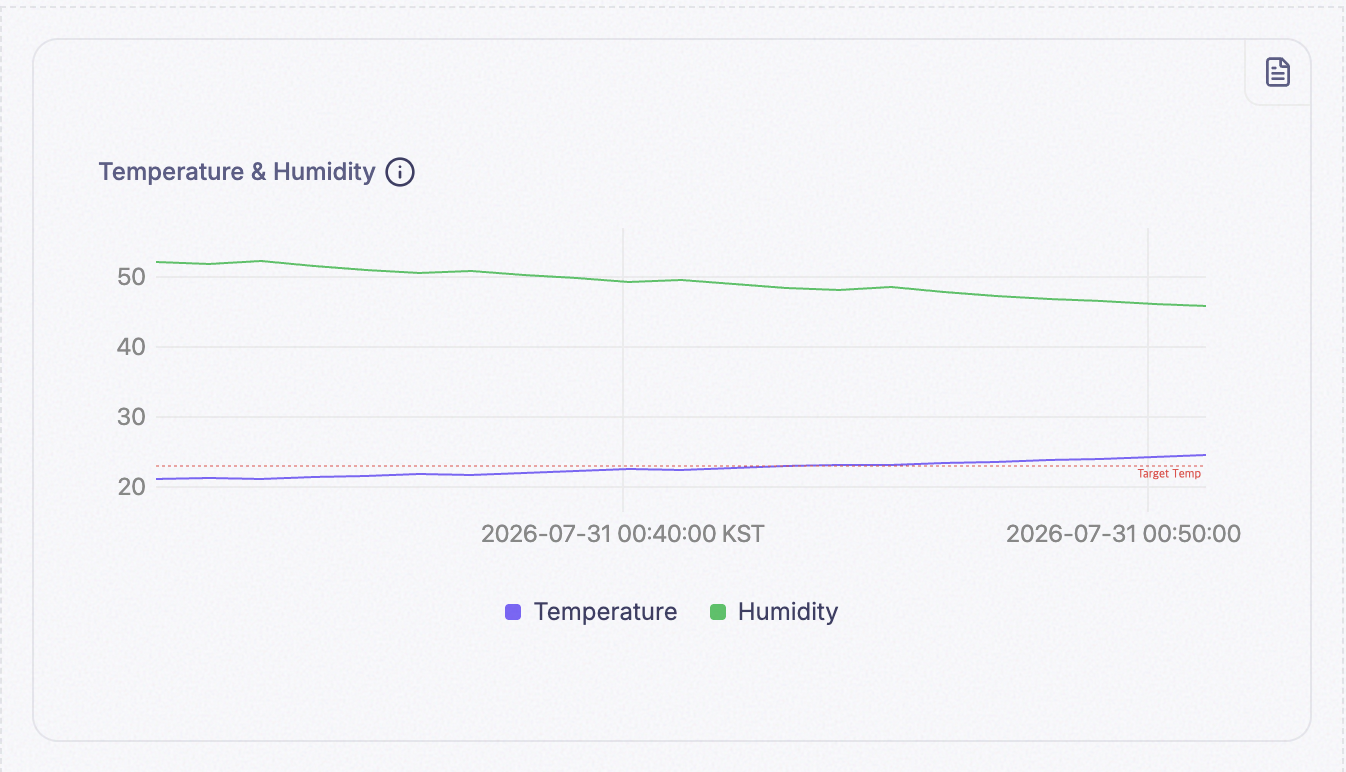
Line draws just the line, which stays readable with several overlapping series. Bar draws one bar
per bucket, which suits discrete counts (like COUNT or SUM) better than a continuous reading.
Step 12: Set Min Value, Max Value, and Show Points
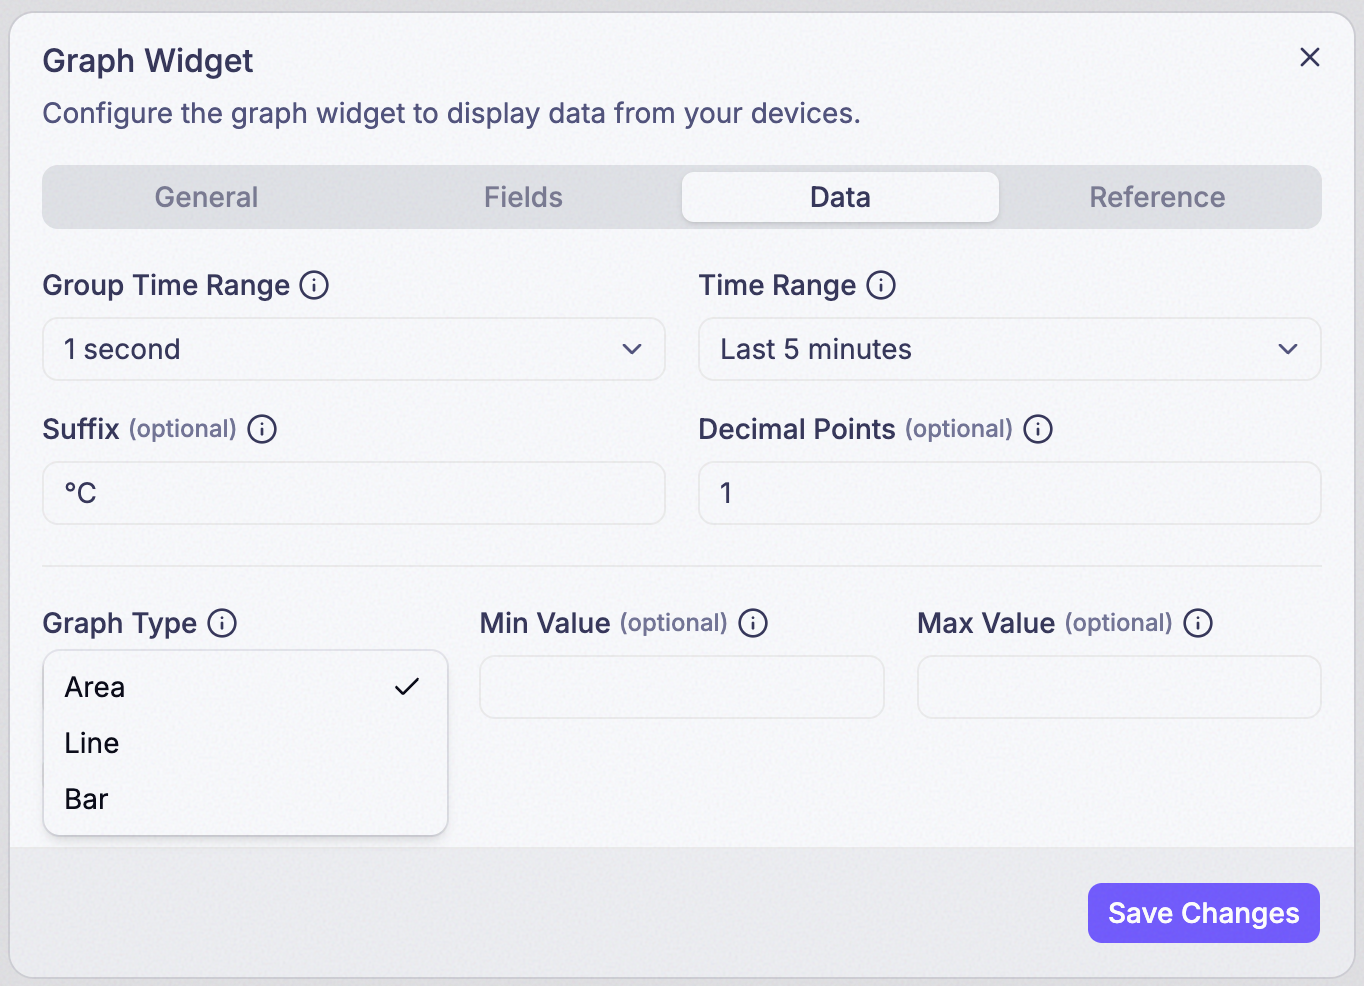
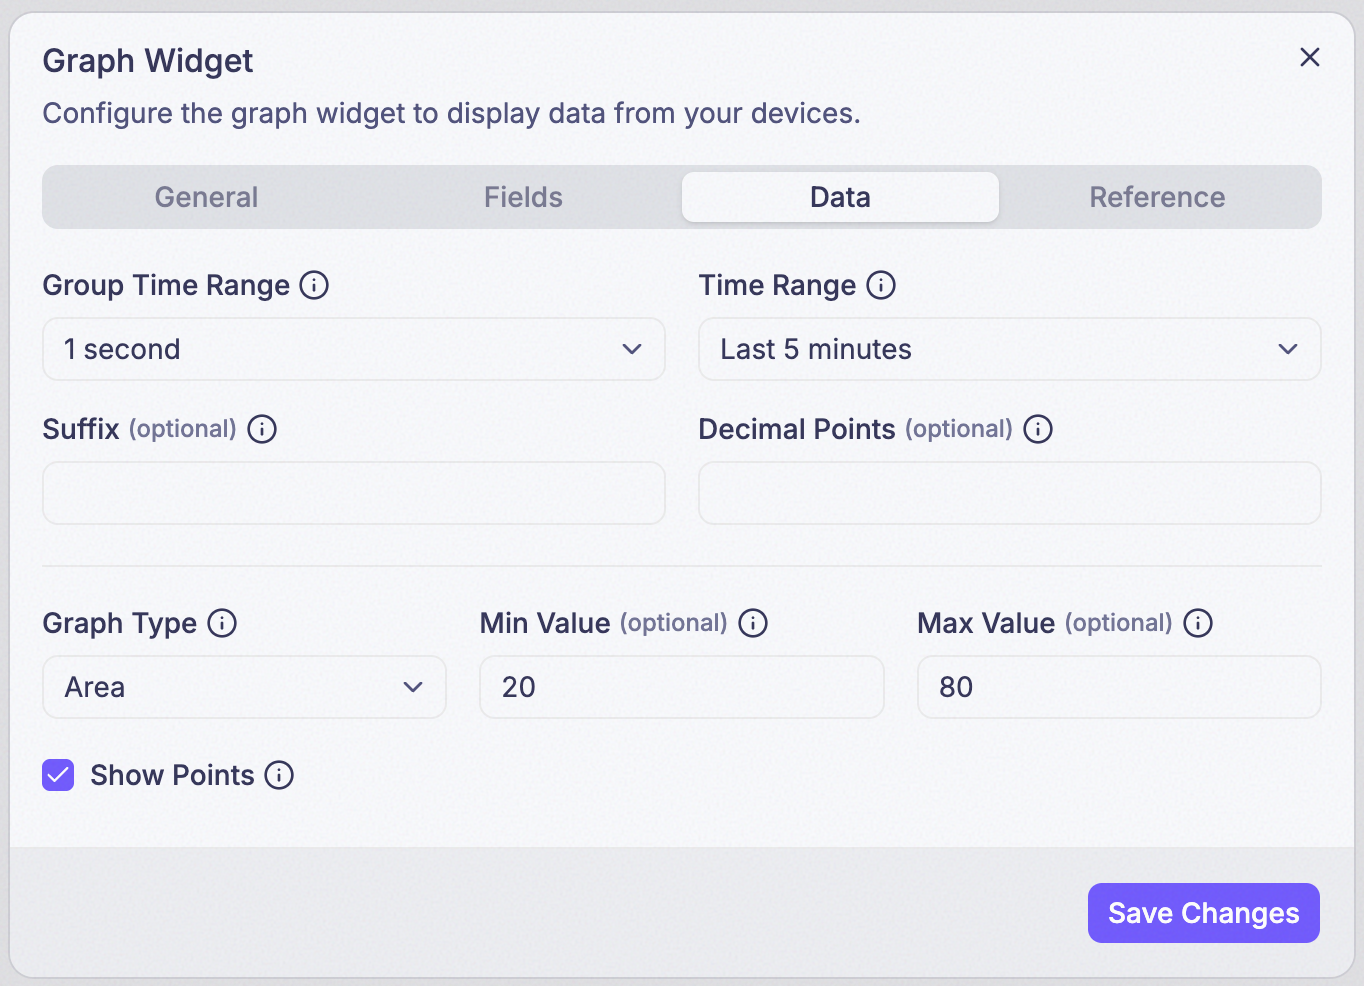
Min Value / Max Value (optional) fix the Y-axis scale instead of auto-scaling to the data. Show Points marks each individual data point on the line.
Step 13: Add a reference line (optional)
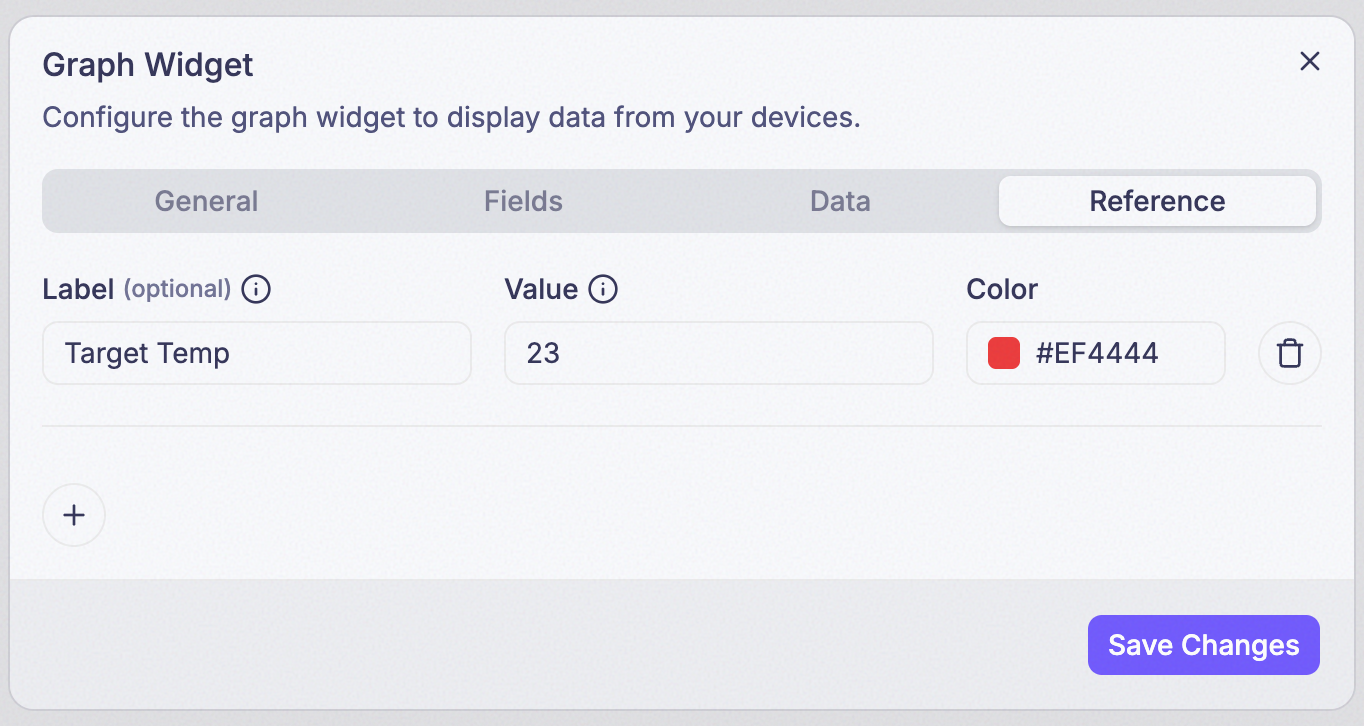
Each line gets a Label (optional) and a Value. Use it to mark a fixed threshold the data should stay under or above — a safe operating limit, a target, a spec — so the chart itself shows when a series crosses it, instead of making the viewer compare against a number in their head.
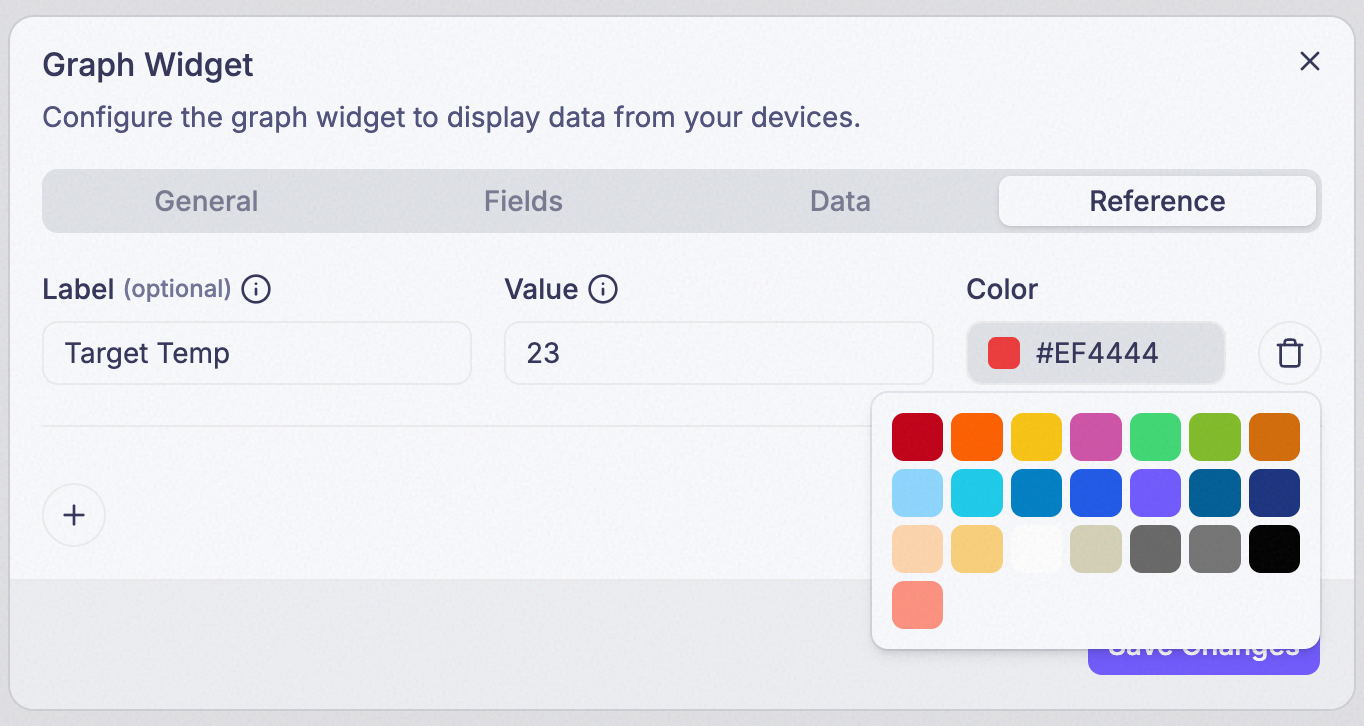
Step 14: Set the reference line’s Color
You can’t add the same field, with the same aggregate, from the same
device, more than once to the same chart. Every series has to be uniquely
identifiable by that triple — otherwise two lines would be plotting the
identical data. If you need the same field shown two ways (say, AVG and
MAX), that’s two series, each with a different Aggregate.
Reference lines are always horizontal. Every new one is drawn against the Y-axis, and there’s no control in the editor to switch one to a vertical line.
There’s also a ceiling on how many points a chart can compute — roughly 3,000 (Time Range ÷ Interval). A 1-second Interval over a 90-day Time Range asks for far more than that and won’t save. If a Graph refuses to save, widen the Interval or shorten the Time Range.
Example
The same Temperature & Humidity data from Steps 1–14, drawn with each Graph Type from Step 11 — same fields, same Reference Line, only the Graph Type changes:
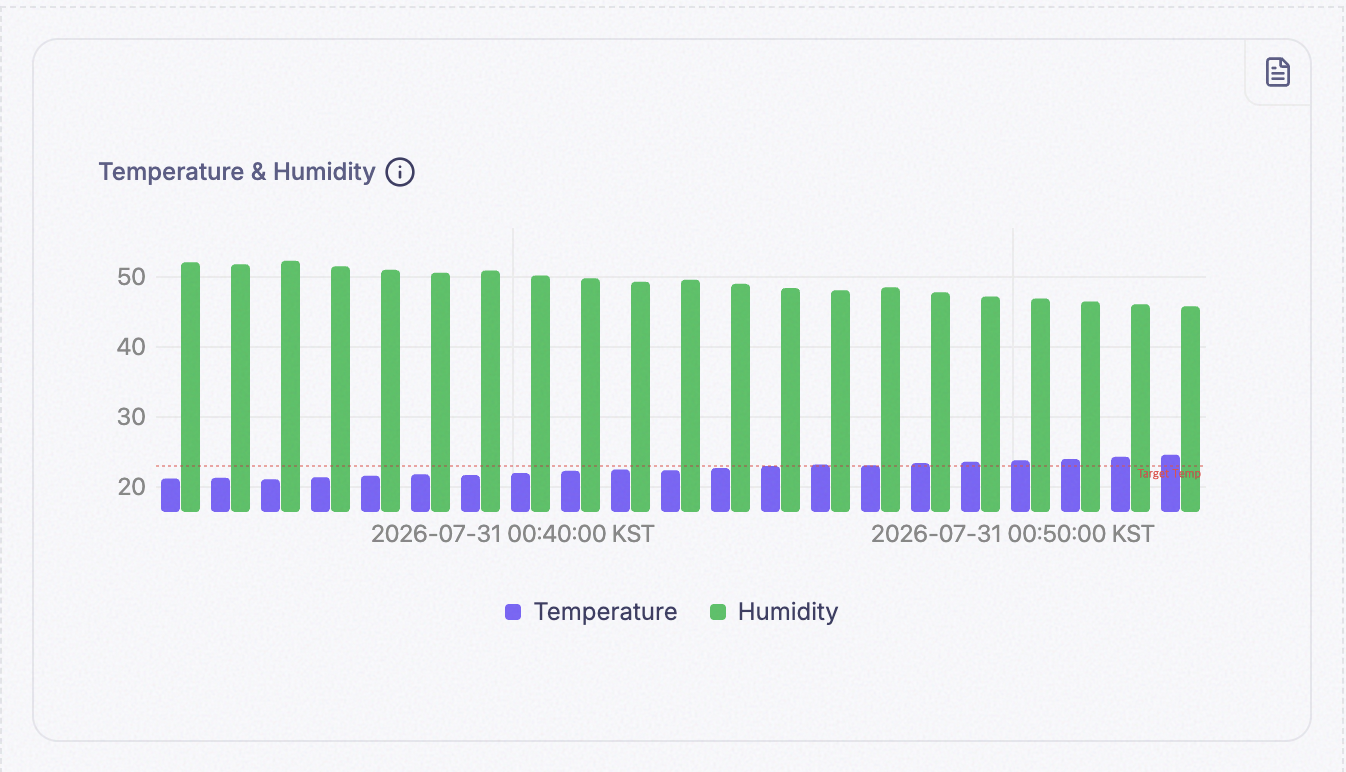
Clicking the detail-view icon in the card’s top-right corner opens a larger view of the same chart:
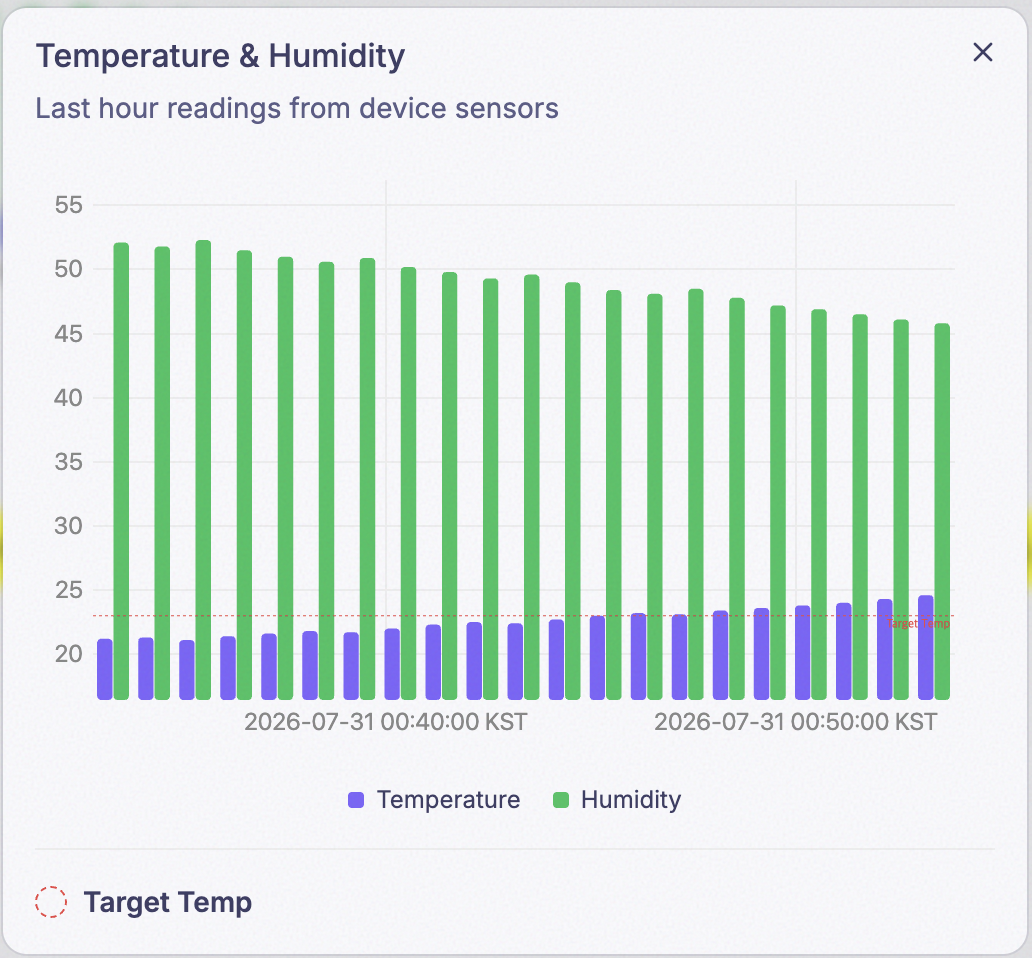
The detail view is the one place a Graph’s Description shows up as plain text underneath the Title, instead of hiding behind the info icon (ⓘ) tooltip. It also lists every Reference Line’s Label in a small legend at the bottom — useful if a chart has more reference lines than fit comfortably next to the axis.