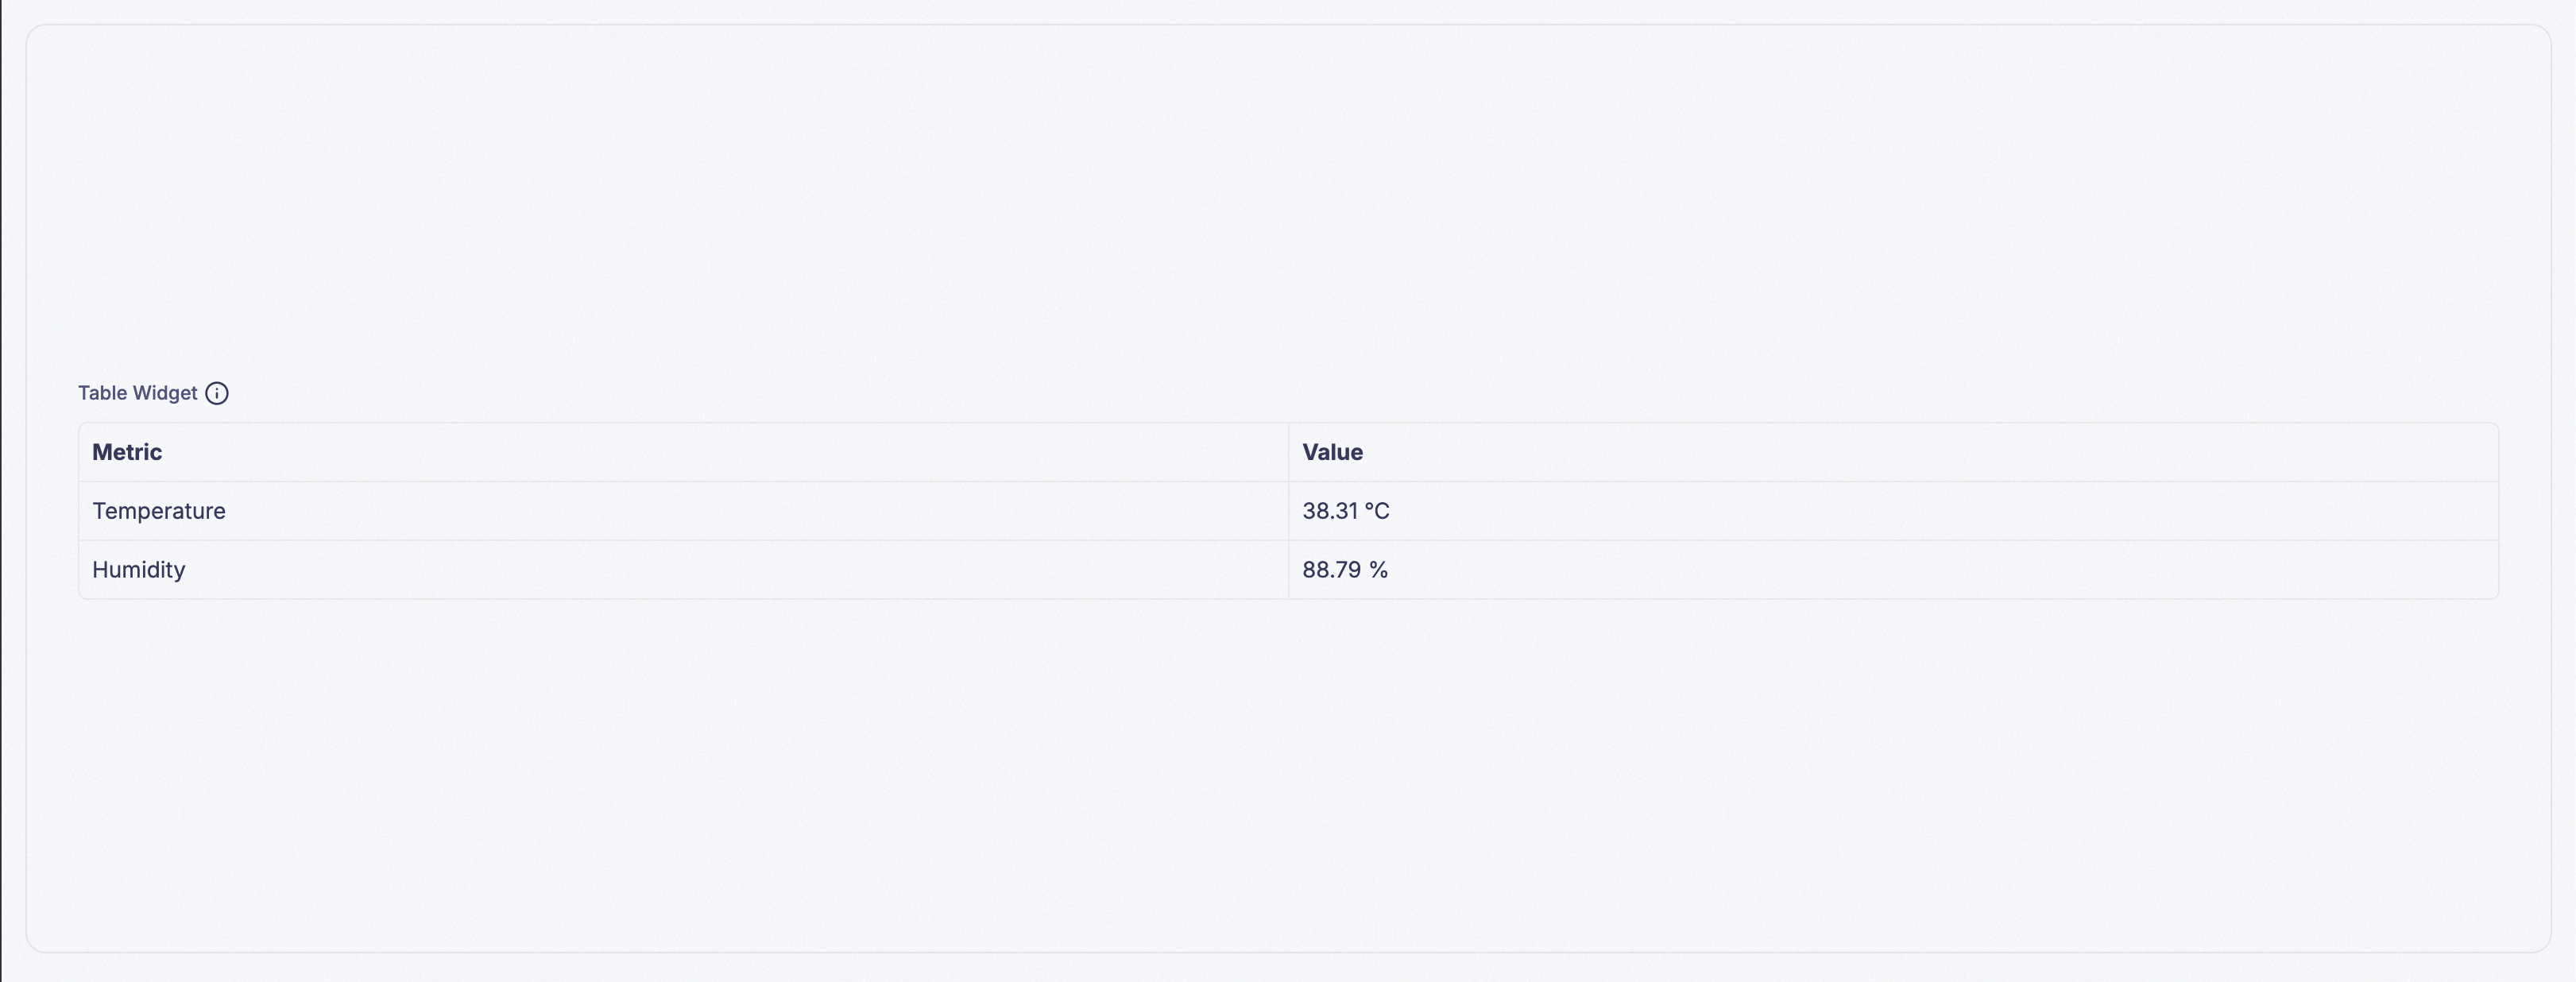
11. Table Widget
Lays out several other widgets in a grid instead of stacking them individually — the widget to reach for when the story is “here are several readings, side by side,” rather than any one of them on its own. Comparing five devices’ battery levels as five separate Single Value widgets works, but takes up five times the space and gives the eye nowhere obvious to start; the same five numbers in one table read as a single comparison instead of five unrelated cards.
- Examples:
- A status table listing multiple devices and their current operational text states side-by-side.
- A table aggregating the latest single-value temperature readings across multiple zones.
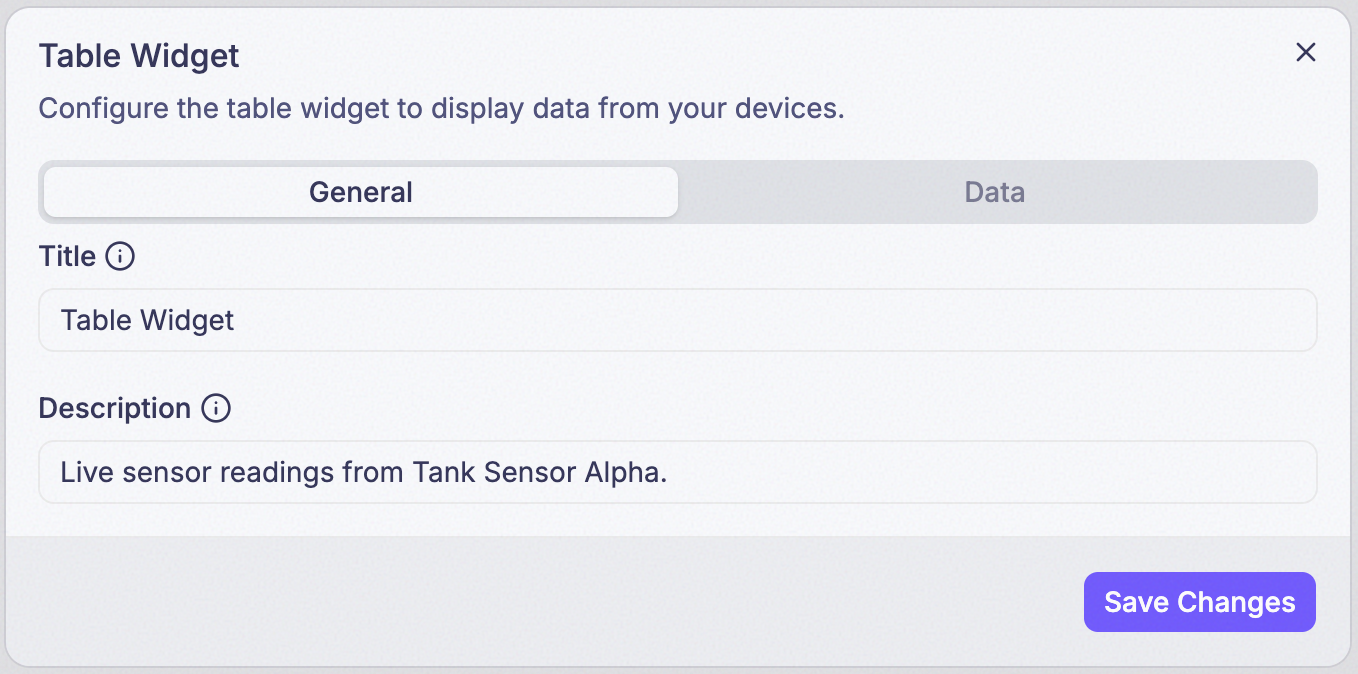
Step 1: Set Title and Description
Title is what’s actually displayed as the widget’s heading. Description isn’t shown on the card at all — it only appears in a tooltip when someone hovers the info icon (ⓘ) next to the title.
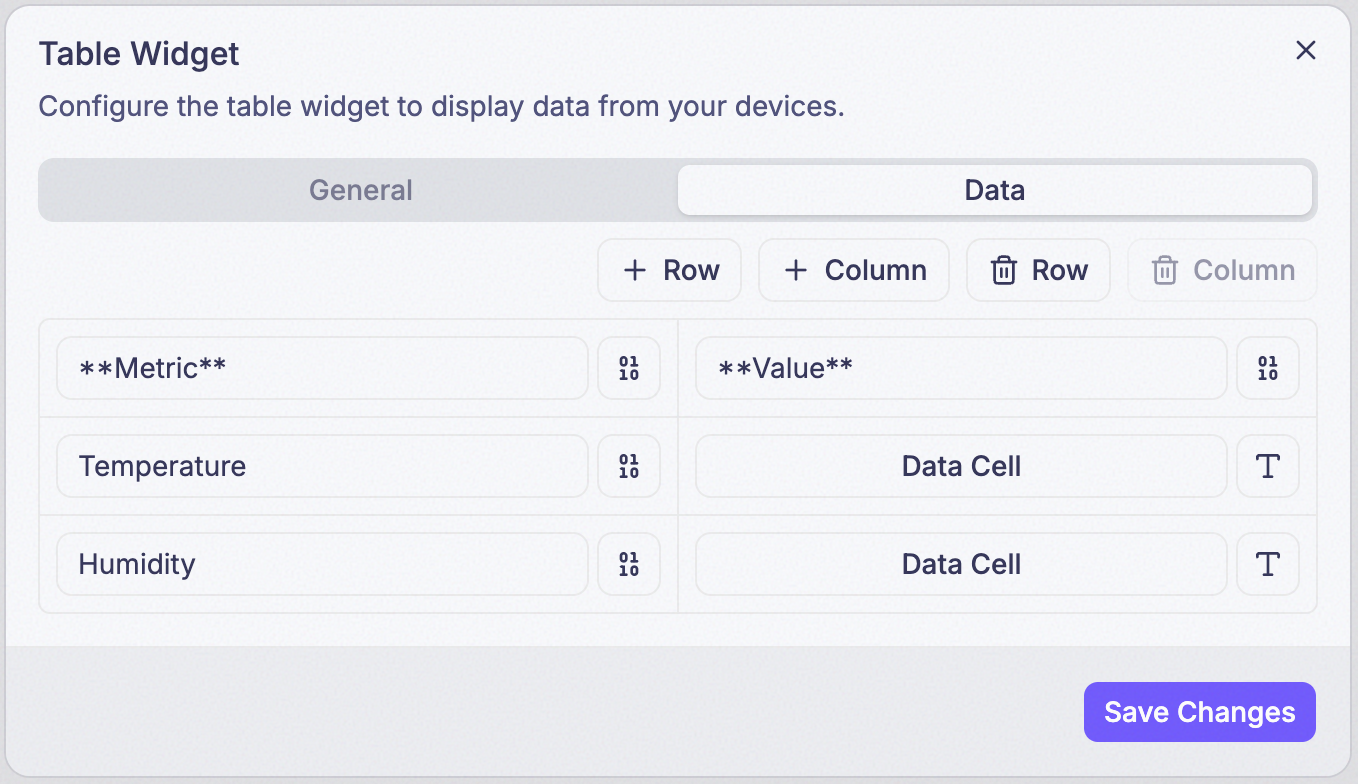
Step 2: Switch to the grid
A table starts as a 2×2 grid. There are no column headers — every cell is either a Text cell or a Data cell.
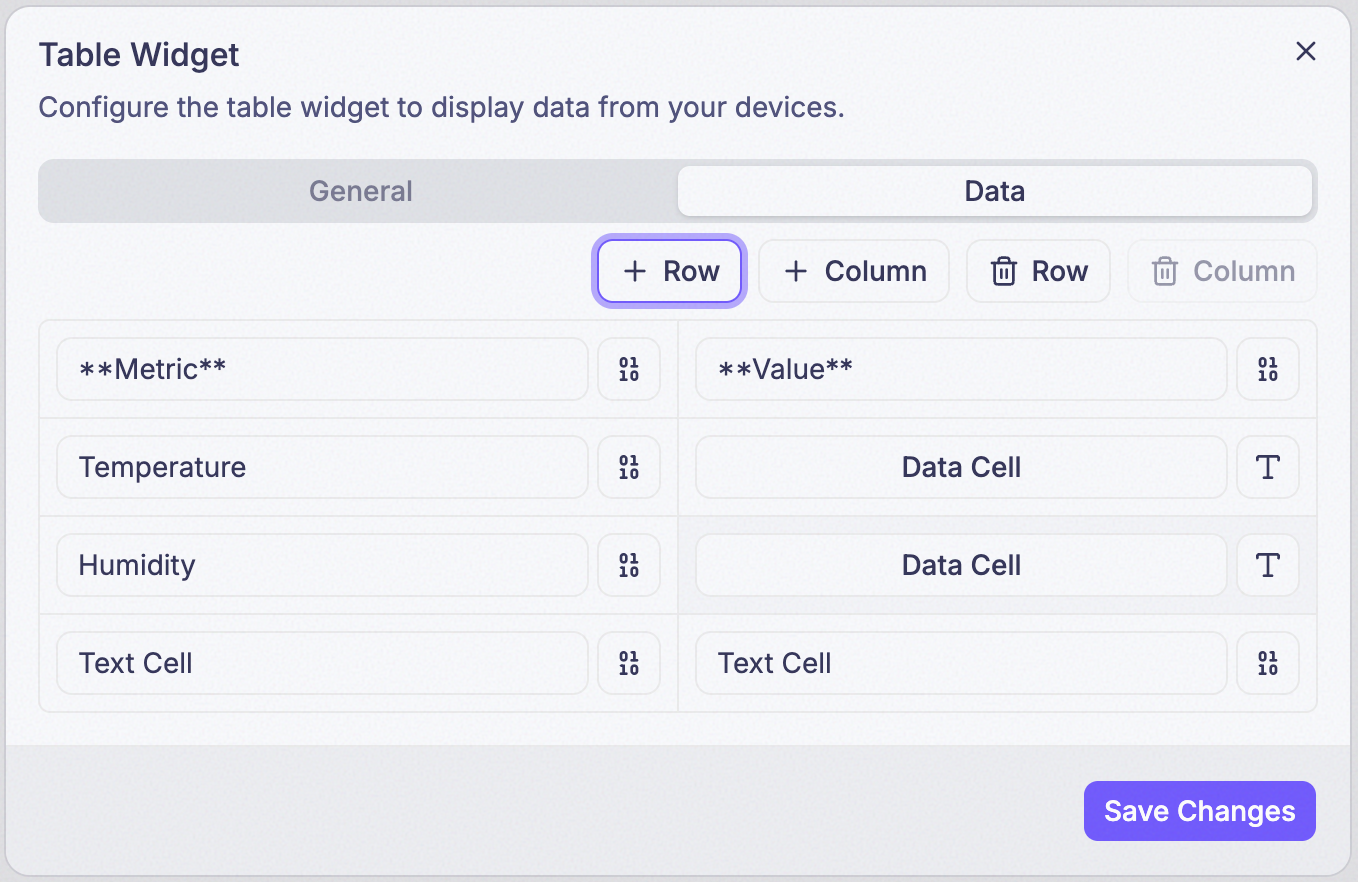
Step 3: Add a Row
Step 4: Add a Column
Row and Column also each have a matching remove button, but the grid can’t shrink below 2×2.
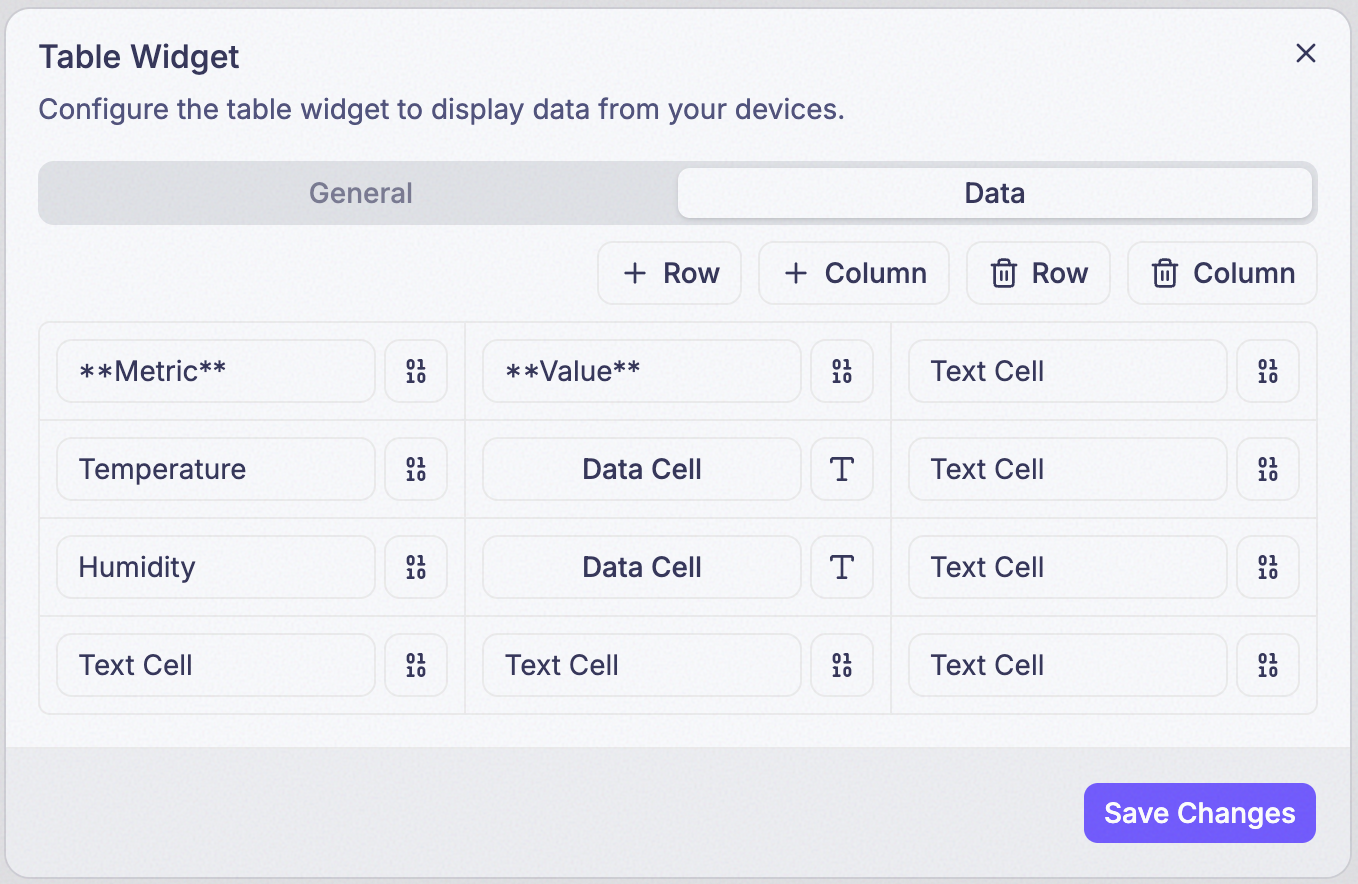
Step 5: Turn a cell into a Data Cell
Every cell starts as a Text cell. Click Data Cell on any cell to open a nested config dialog and turn it into a full Single Value reading for that one cell.
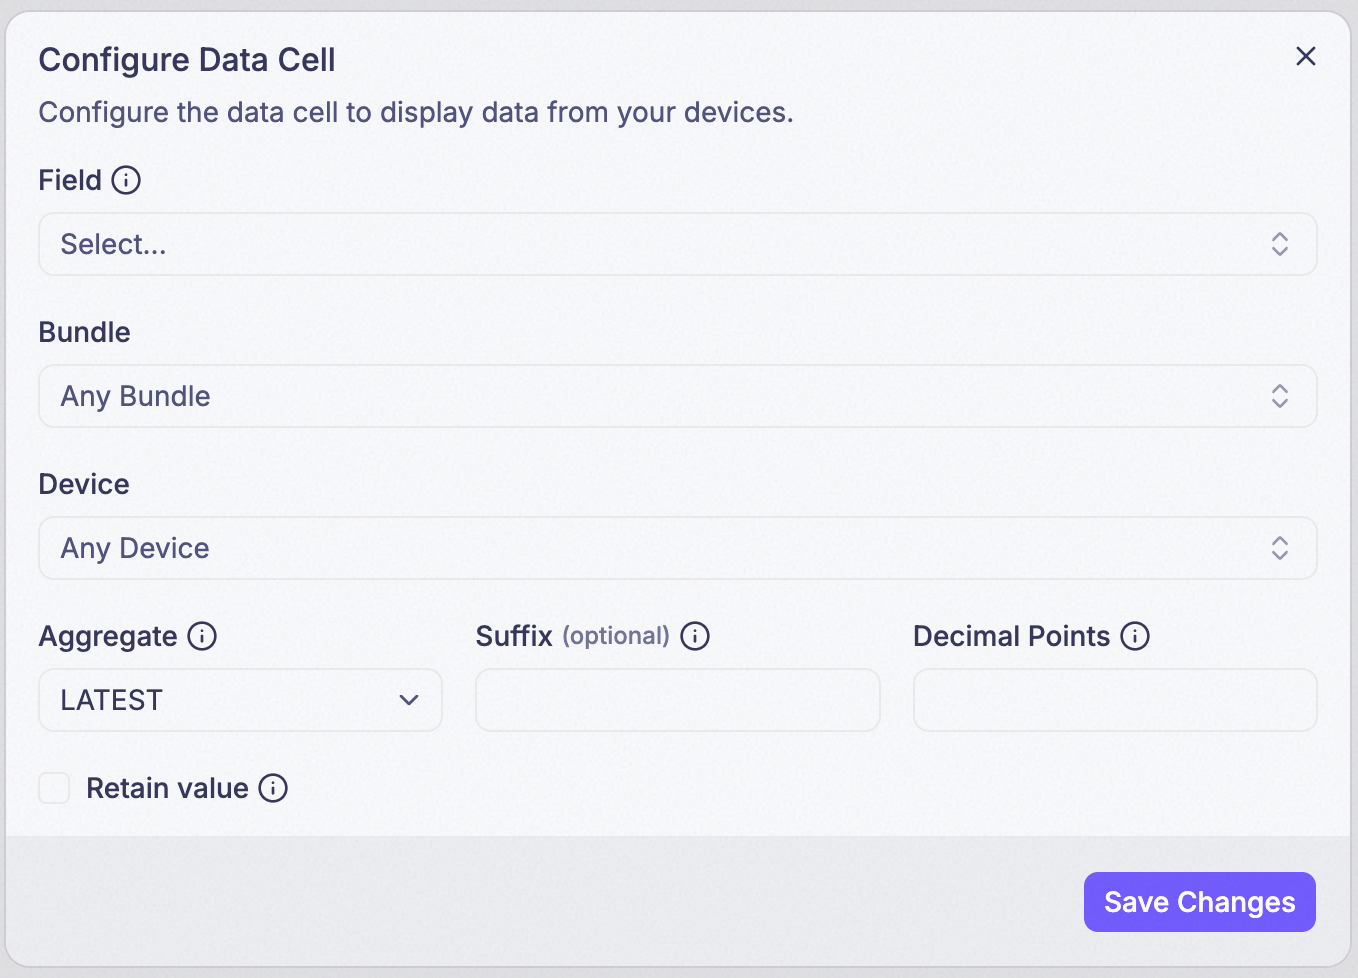
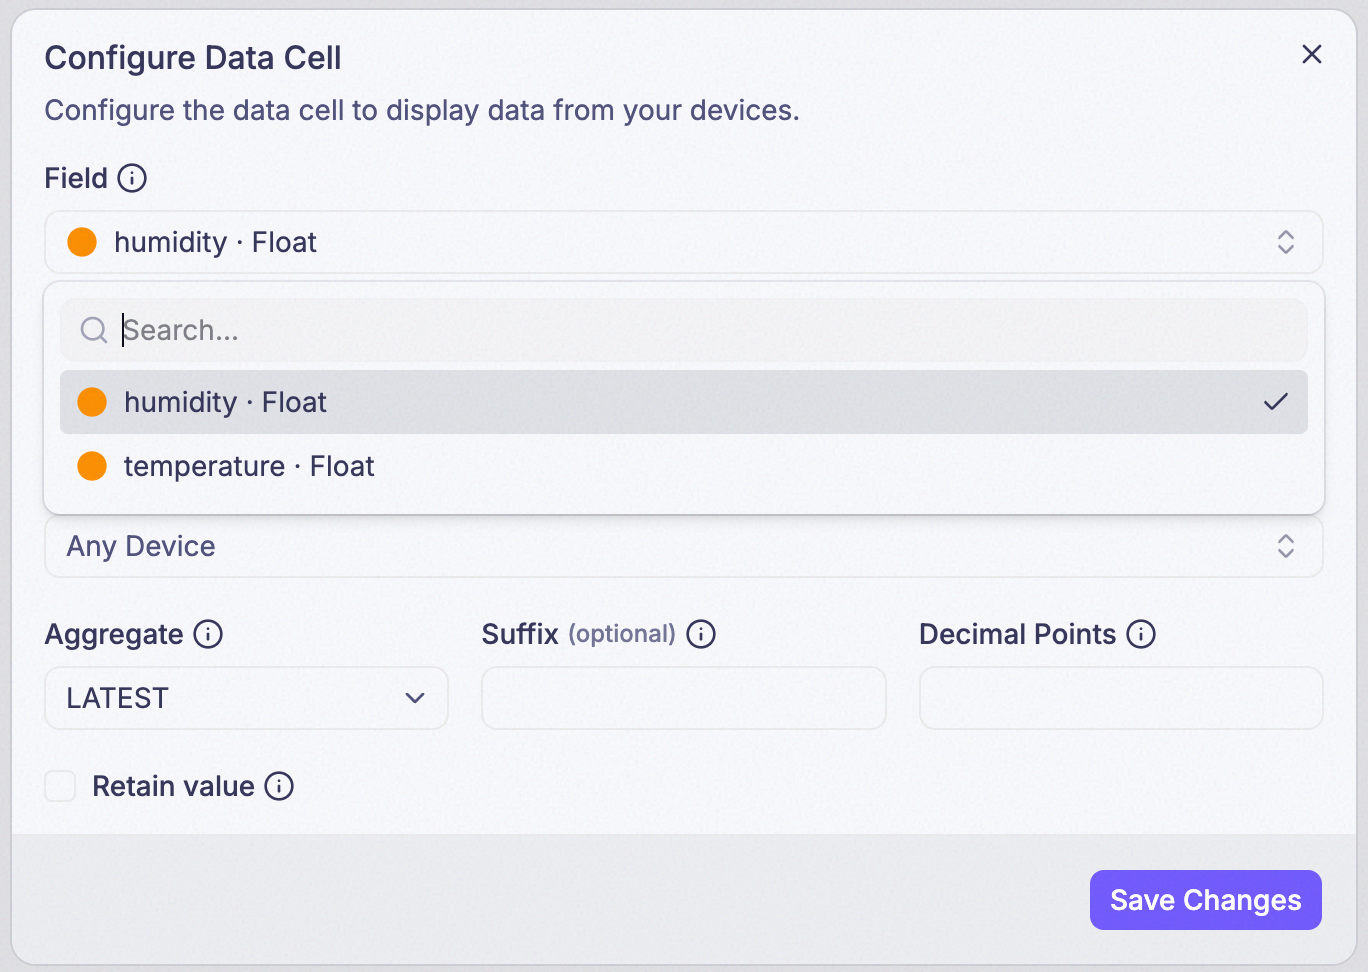
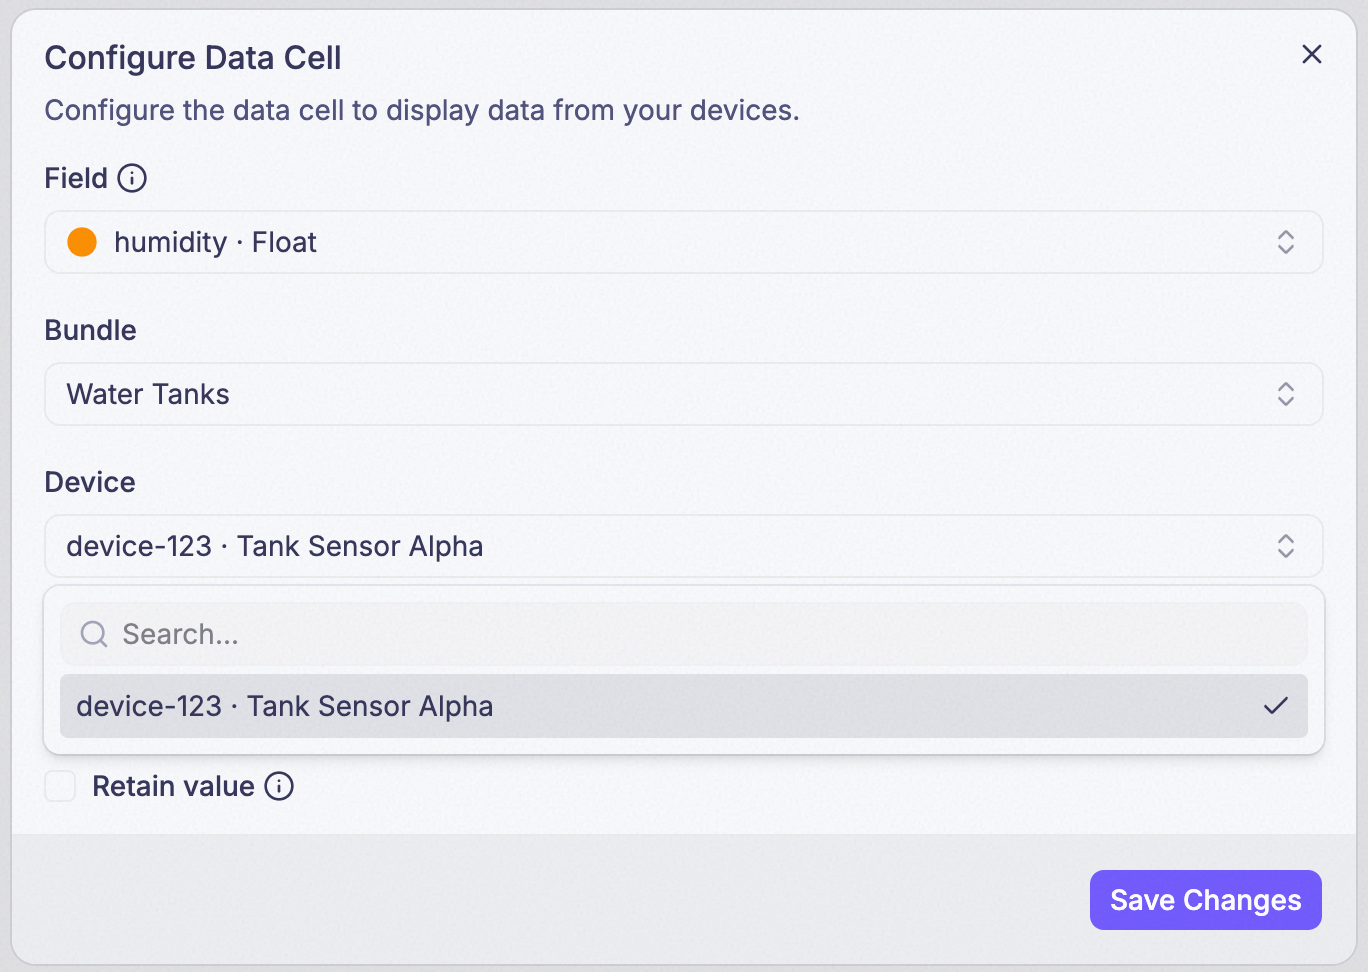
Step 6: Set the Data Cell’s Field
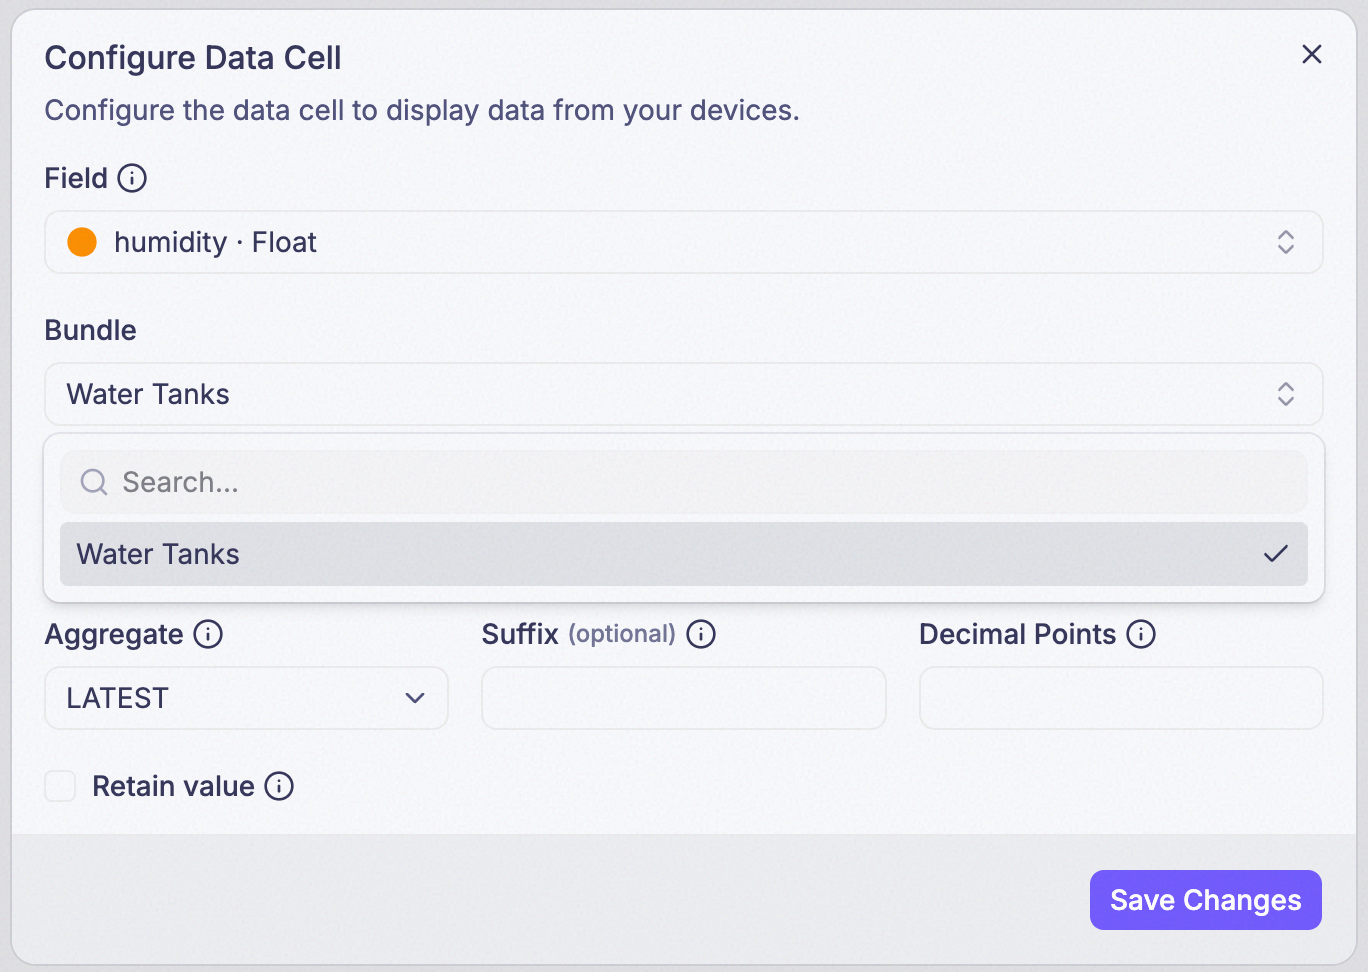
Step 7: Choose a Bundle (optional)
Points the cell at every device in a bundle instead of one device. Leave it blank to pick a single device instead, in the next step.
Step 8: Choose a Device (optional)
Points the cell at one specific device. Leave both Bundle and Device blank and the cell reads from any device that reports the field.
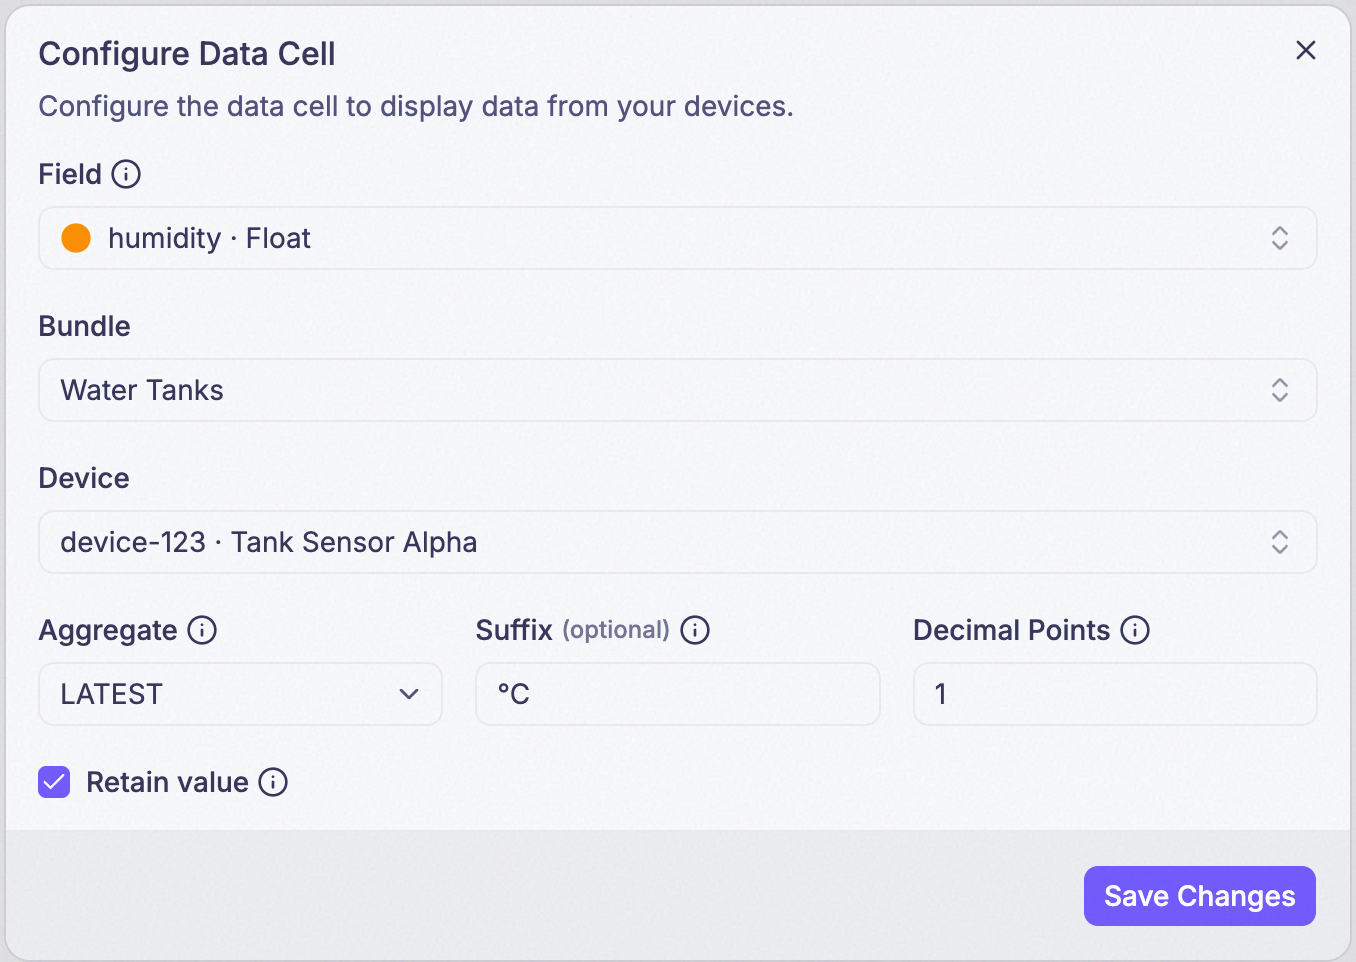
Step 9: Set the Aggregate, Suffix, Decimal Points, and Retain
Aggregate decides which single number the cell shows:
| Mode | Shows |
|---|---|
LATEST | The most recent reading — ignores Time Range; see the callout below |
COUNT | How many readings arrived |
SUM | All readings added together |
AVG | The average of all readings |
MIN | The lowest reading |
MAX | The highest reading |
FIRST | The earliest reading inside the Time Range |
LAST | The most recent reading inside the Time Range |
VARIANCE | Statistical variance of the readings |
STDDEV | Standard deviation of the readings |
Picking anything other than LATEST reveals a Time Range field. Suffix is an optional unit shown
after the number. Decimal Points takes 0 to 5, and defaults to 2 if left blank. Retain only
appears when Aggregate is LATEST.
A cell can only be Text or Data (Single Value) — never a Graph, Gauge, or Image. If a reading needs a chart or a gauge to make sense, it belongs on the dashboard as its own widget, not inside a table cell.
The Data Cell dialog reuses the Single Value widget’s reading settings only — there’s no Title or Description field in it, so an individual cell can’t have its own.
LATEST and LAST sound like the same thing and aren’t. LAST respects
whatever Time Range you set; LATEST ignores Time Range entirely and
looks back 15 minutes on its own (30 days with Retain on). See the
full explanation on the Single Value
Widget page.
Example